2020-01-15
Recap @ 301
Previous lectures
Moving from programming to data science
- Basic types and variables
- The pipe operator
- Complex data types
- Data wrangling
- Data selection
- Data filtering
- Data manipulation
- Join operations
- Table re-shaping
- Read and write data
This lecture
Reproducibility in (geographic) data science
- What is reproducible data analysis?
- why is it important?
- software engineering
- practical principles
- Tools
- Markdown
- RMarkdown
- Git
See also: Christopher Gandrud, Reproducible Research with R and R Studio also available on GitHub
Reproducibility
Reproduciblity
In quantitative research, an analysis or project are considered to be reproducible if:
- “the data and code used to make a finding are available and they are sufficient for an independent researcher to recreate the finding.” Christopher Gandrud, Reproducible Research with R and R Studio
That is becoming more and more important in science:
- as programming and scripting are becoming integral in most disciplines
- as the amount of data increases
Why?
In scientific research:
- verificability of claims through replication
- incremental work, avoid duplication
For your working practice:
- better working practices
- coding
- project structure
- versioning
- better teamwork
- higher impact (not just results, but code, data, etc.)
Reproducibility and software engineering
Core aspects of software engineering are:
- project design
- software readibility
- testing
- versioning
As programming becomes integral to research, similar necessities arise among scientists and data analysts.
Reproducibility and “big data”
There has been a lot of discussions about “big data”…
- volume, velocity, variety, …
Beyond the hype of the moment, as the amount and complexity of data increases
- the time required to replicate an analysis using point-and-click software becomes unsustainable
- room for error increases
Workflow management software (e.g., ArcGIS ModelBuilder) is one answer, reproducible data analysis based on script languages like R is another.
Reproducibility in GIScience
Singleton et al. have discussed the issue of reproducibility in GIScience, identifying the following best practices:
- Data should be accessible within the public domain and available to researchers.
- Software used should have open code and be scrutable.
- Workflows should be public and link data, software, methods of analysis and presentation with discursive narrative
- The peer review process and academic publishing should require submission of a workflow model and ideally open archiving of those materials necessary for replication.
- Where full reproducibility is not possible (commercial software or sensitive data) aim to adopt aspects attainable within circumstances
Document everything
In order to be reproducible, every step of your project should be documented in detail
- data gathering
- data analysis
- results presentation
Well documented R scripts are and excellent way to document your project.
Document well
Create code that can be easily understandable to someone outside your project, including yourself in six-month time!
- use a style guide (e.g. tidyverse) consistently
- add a comment at the beginning of a file, including
- date
- contributors
- other files the current file depends on
- materials, sources and other references
- add a comment before each code block, describing what the code does
- also add a comment before any line that could be ambiguous or particularly difficult or important
Workflow
Relationships between files in a project are not simple:
- in which order are file executed?
- when to copy files from one folder to another, and where?
A common solution is using make files
- commonly written in bash on Linux systems
- they can be written in R, using commands like
- source to execute R scripts
- system to interact with the operative system
Future-proof formats
Complex formats (e.g., .docx, .xlsx, .shp, ArcGIS .mxd)
- can become obsolete
- are not always portable
- usually require proprietary software
Use the simplest format to future-proof your analysis.
Text files are the most versatile
- data: .txt, .csv, .tsv
- analysis: R scrpts, python scripts
- write-up: LaTeX, Markdown, HTML
Store and share
Reproducible data analysis is particularly important when working in teams, to share and communicate your work.
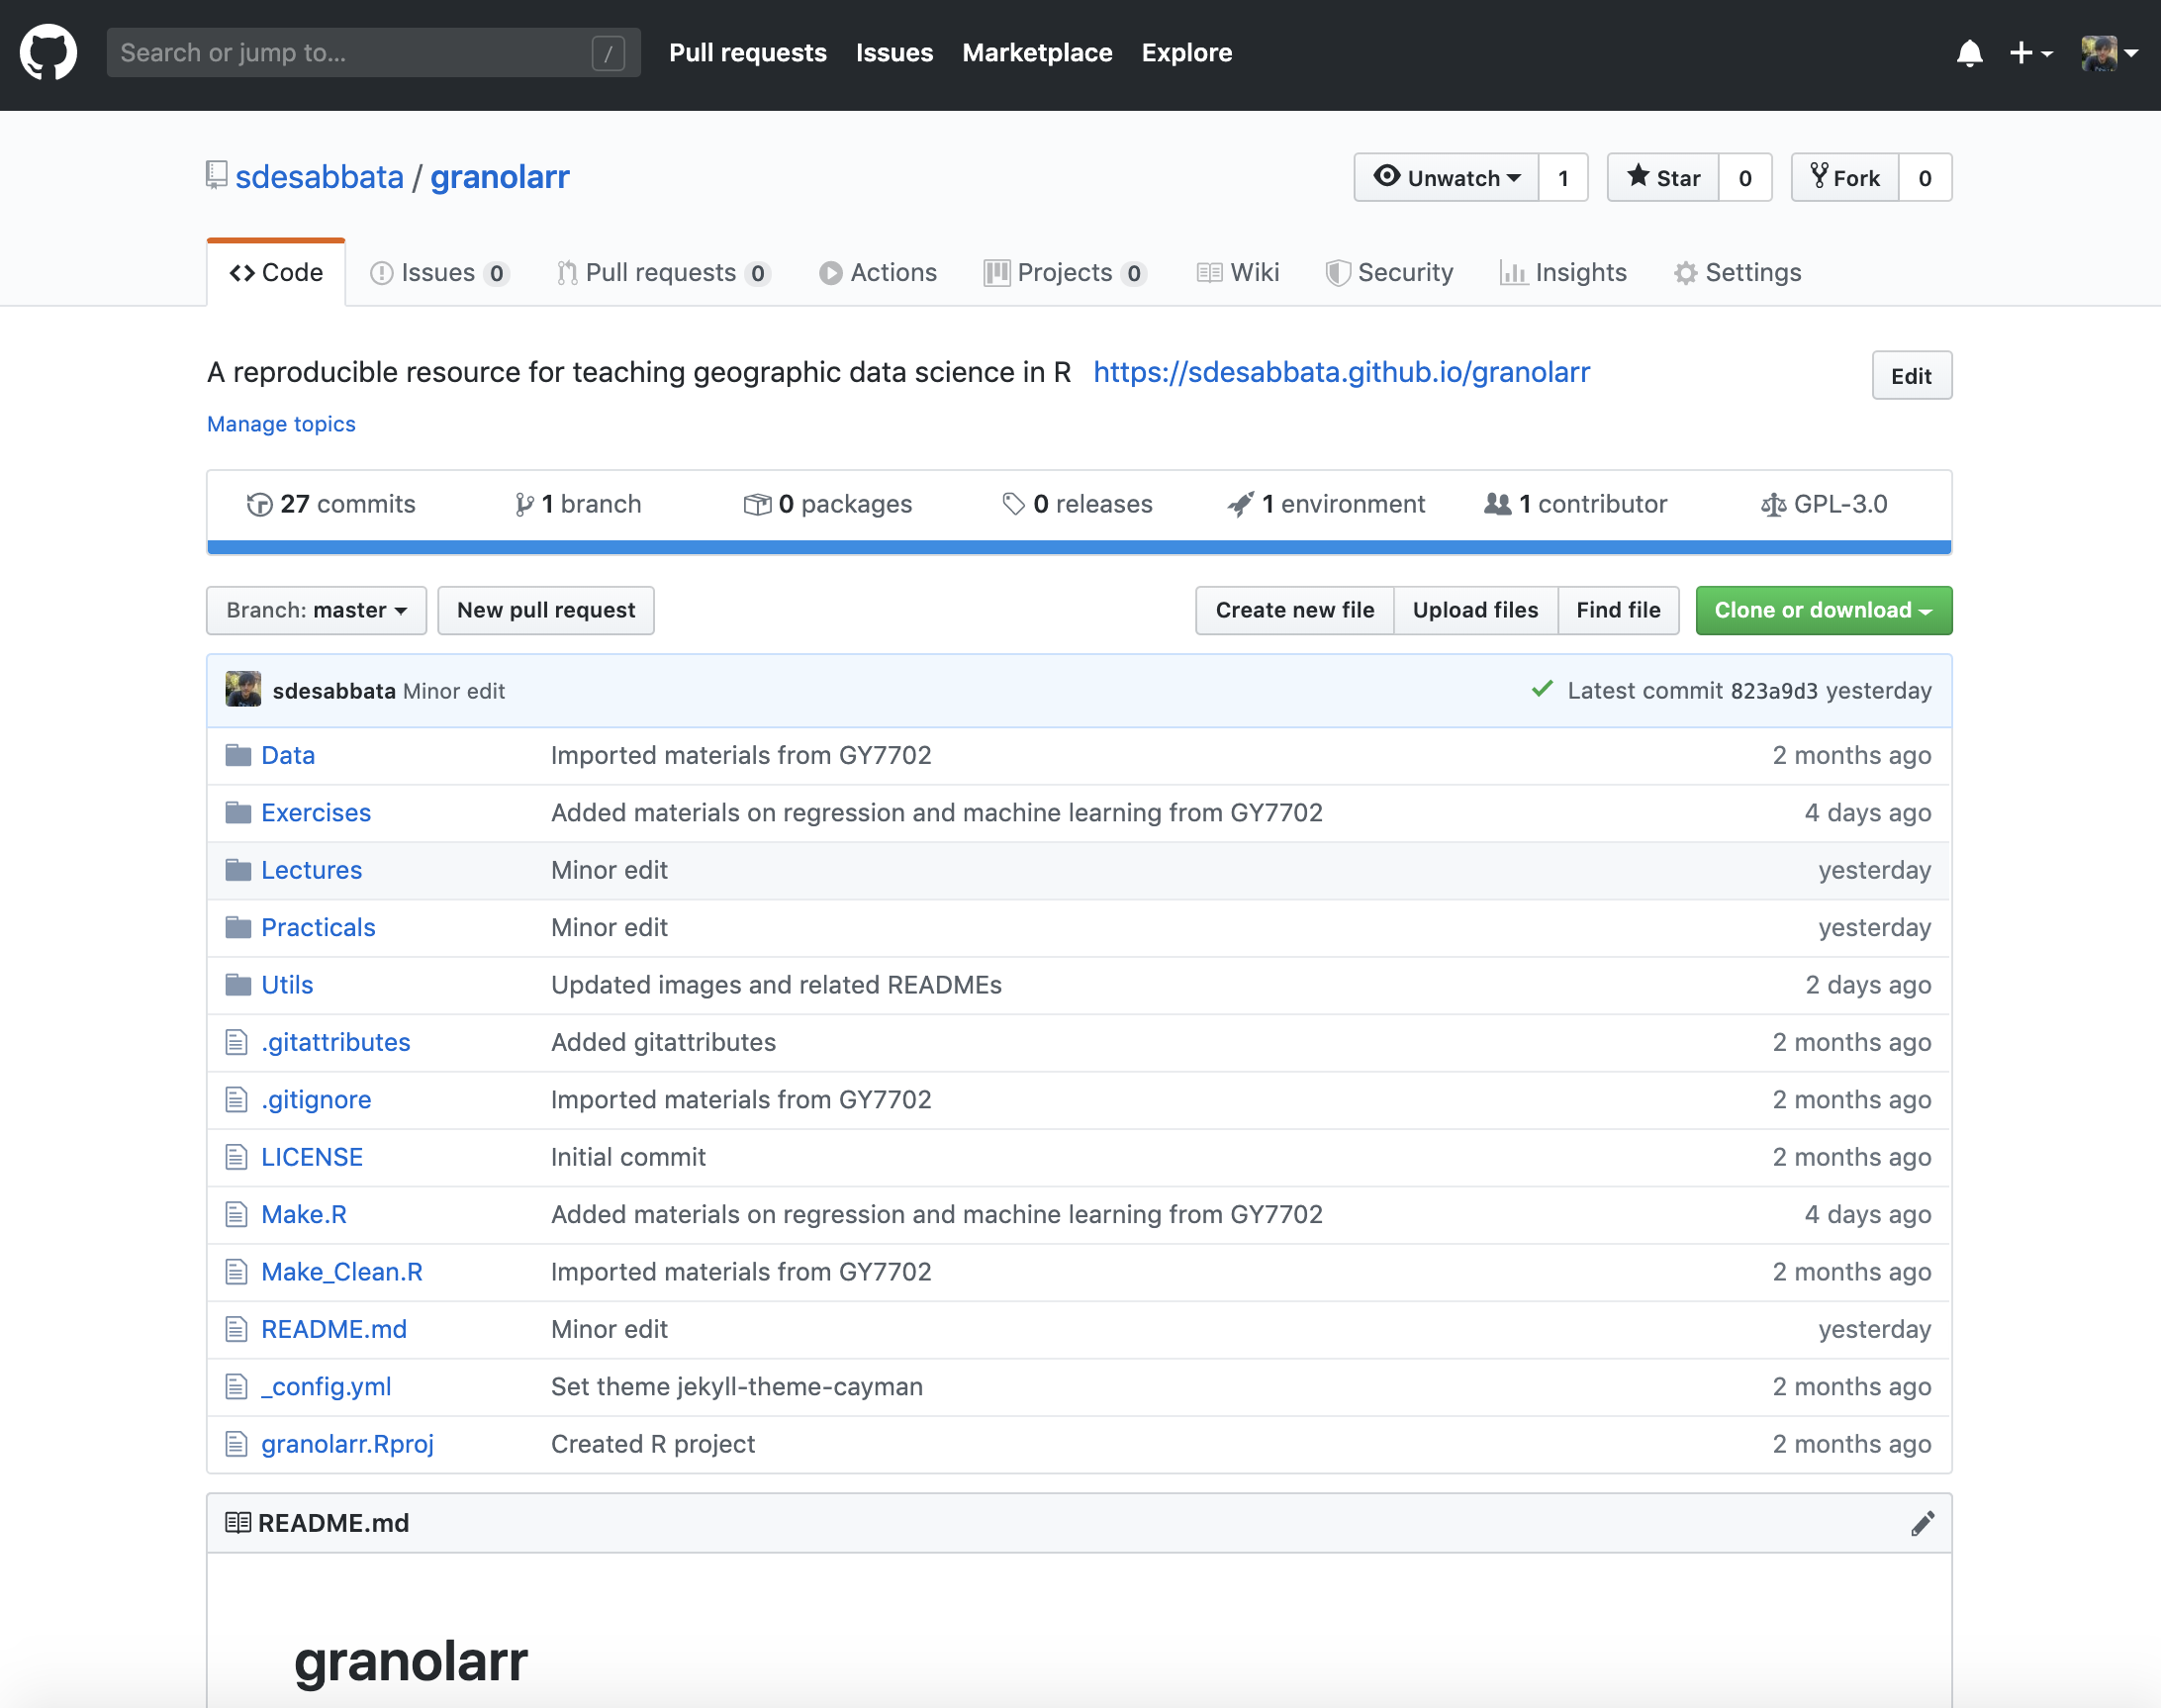
This repository
RMarkdown
Markdown
Markdown is a simple markup language
- allows to mark-up plain text
- to specify more complex features (such as italics text)
- using a very simple syntax
Markdown can be used in conjunction with numerous tools
- to produce HTML pages
- or even more complex formats (such as PDF)
These slides are written in Markdown
Markdown example code
### This is a third level heading

Text can be specified as *italic* or **bold**

- and list can be created
    - very simply

1. also numbered lists
    1. [add a link like this](http://le.ac.uk)

|Tables |Can         |Be       |
|-------|------------|---------|
|a bit  |complicated |at first |
|but    |it gets     |easier   |
Markdown example output
This is a third level heading
Text can be specified as italic or bold
- and list can be created
- very simply
- also numbered lists
| Tables | Can | Be |
|---|---|---|
| a bit | complicated | at first |
| but | it gets | easier |
RMarkdown example code
Let's write an example of **R** code including

- a variable `a_variable`
- an assignment operation (i.e., `<-`)
- a mathematical operation (i.e., `+`)

```{r, echo=TRUE}
a_variable <- 0
a_variable <- a_variable + 1
a_variable <- a_variable + 1
a_variable <- a_variable + 1
a_variable
```
Writing RMarkdown docs
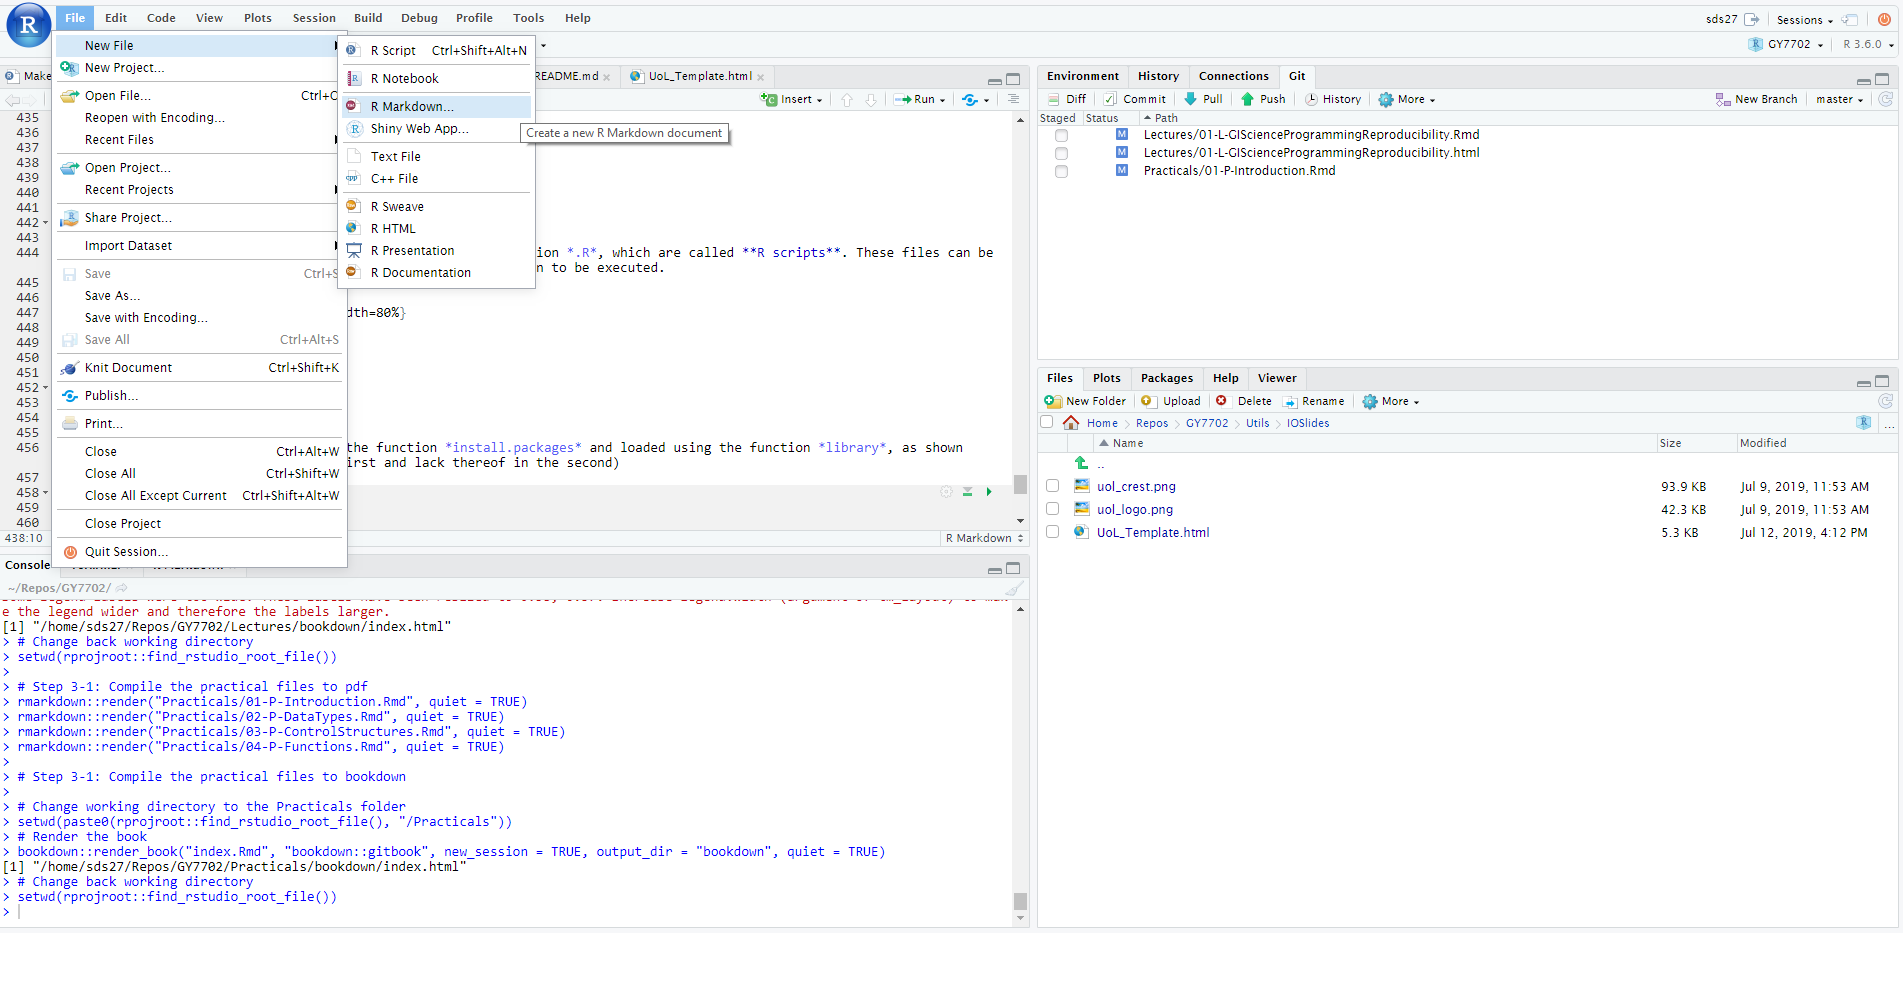
RMarkdown documents contain both Markdown and R code. These files can be created in RStudio, and compiled to create an html page (like this document), a pdf, or a Microsoft Word document.
Git
What’s git?
Git is a free and opensource version control system
- commonly used through a server
- where a master copy of a project is kept
- can also be used locally
- allows storing versions of a project
- syncronisation
- consistency
- history
- multiple branches
How git works
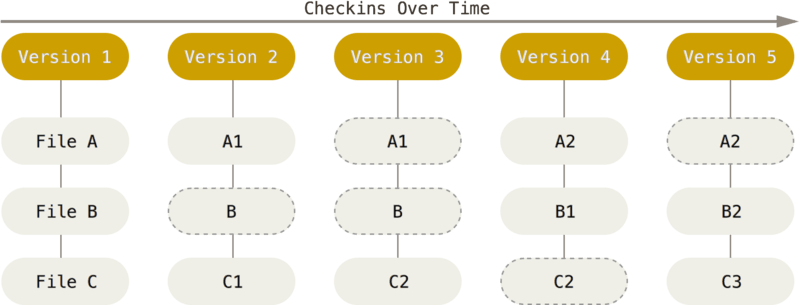
A series of snapshots
- each commit is a snapshot of all files
- if no change to a file, link to previous commit
- all history stored locally
by Scott Chacon and Ben Straub, licensed under CC BY-NC-SA 3.0
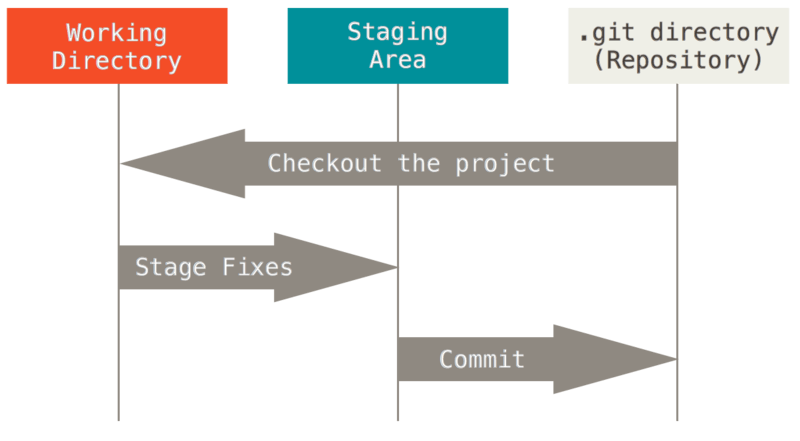
Three stages
When working with a git repository
- first checkout the latest version
- select the edits to stage
- commit what has been staged in a permanent snapshot
by Scott Chacon and Ben Straub, licensed under CC BY-NC-SA 3.0
Basic git commands
git clone- copy a repository from a server
git fetch- get the latest version from a branch
git pull- incorporate changes from a remote repository
git add- stage new files
git commit- create a commit
git push- upload commits to a remote repository
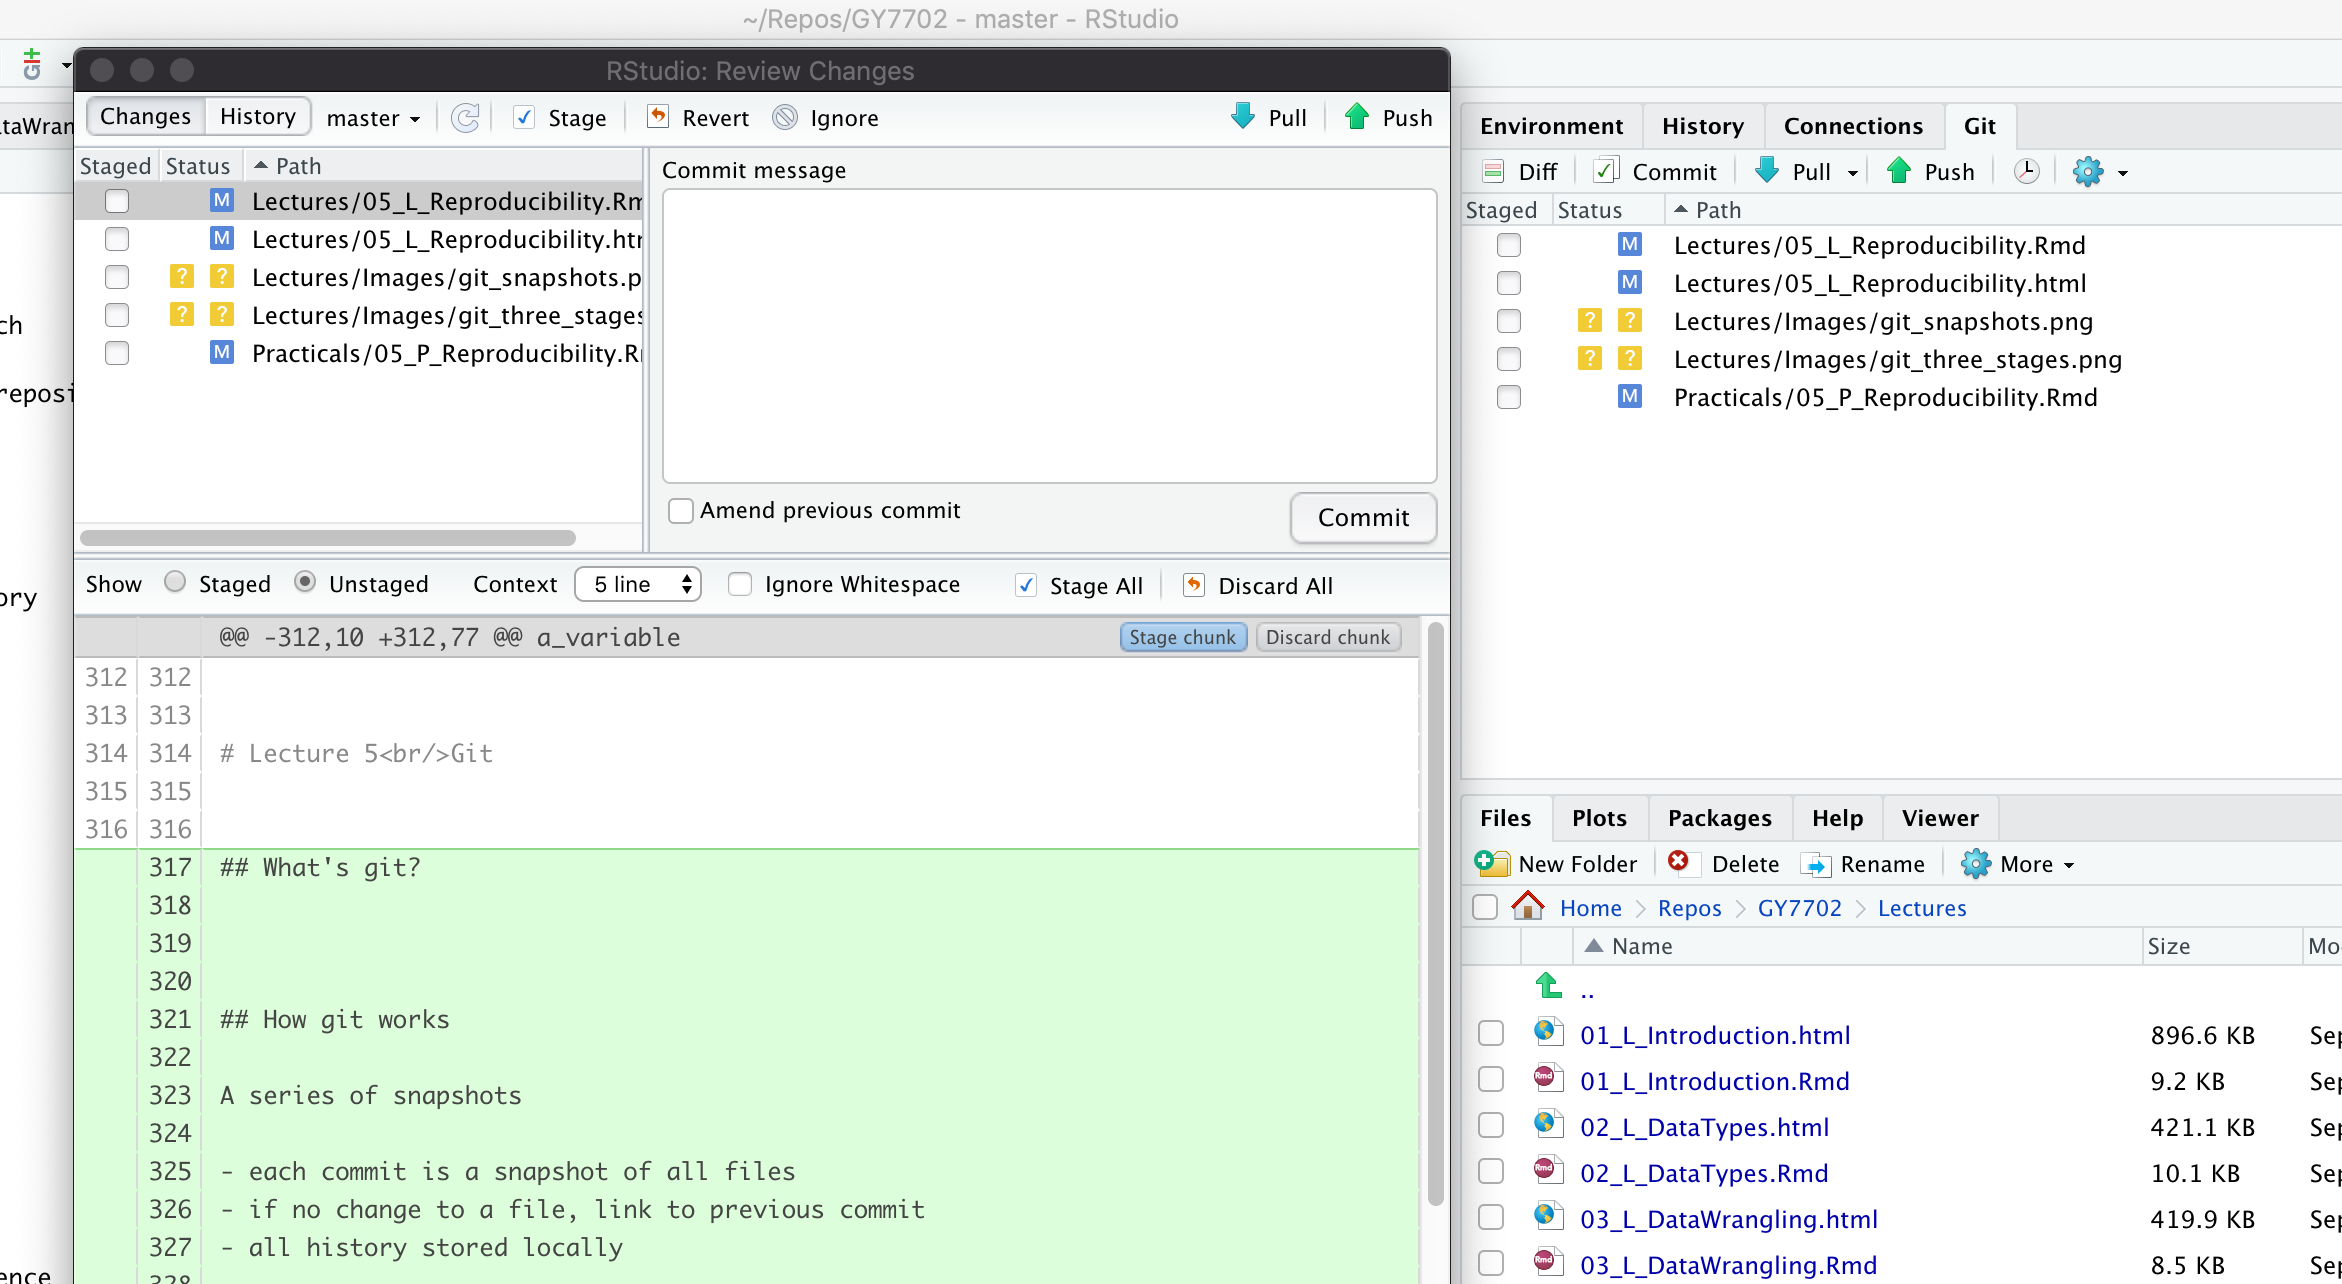
Git and RStudio
RStudio includes a git plug-in
- clone R projects from repositories
- stage and commit changes
- push and pull changes
Summary
Summary
Reproducibility in (geographic) data science
- What is reproducible data analysis?
- why is it important?
- software engineering
- practical principles
- Tools
- Markdown
- RMarkdown
- Git
Practical session
In the practical session, we will see
- Markdown
- Git
- Examples of reproducible data analysis
Next lecture
Exploratory data analysis