class: center, middle, inverse, title-slide .title[ # Everyday digital geographies ] .subtitle[ ## <small><a href="https://dhere.de/locweb/locweb2022/" style="color: white;">LocWeb2022 at WWW2022</a></small> ] .author[ ### Stefano De Sabbata | <a href="https://sdesabbata.github.io/" style="color: white;">sdesabbata.github.io</a> ] .date[ ### <small>2022-04-26</small> ] --- class: center, middle <style type="text/css"> .hide-count .remark-slide-number { display: none; } </style> # "the digital" <br/> ***Information has always had geography***. *It is from somewhere; about somewhere; it evolves and is transformed somewhere; it is mediated by networks, infrastructures, and technologies: all of which exist in physical, material places.* .referencenote[ Graham, M., De Sabbata, S., and Zook, M. A. (2015) [Towards a study of information geographies: (im)mutable augmentations and a mapping of the geographies of information](https://rgs-ibg.onlinelibrary.wiley.com/action/showCitFormats?doi=10.1002%2Fgeo2.8). Geo: Geography and Environment, 2: 1, 88– 105, doi: 10.1002/geo2.8. ] <br/> *"It is now somehow obvious to state that the digital phenomena have radically transformed every aspect of human life. [...] **Digital platforms** are changing what constitutes **"the field"**: the rise of digital content comprises new forms of evidence with which to approach long-standing geographical concerns"* .referencenote[ Ash, J., et al. (2018). [Digital Geographies](https://uk.sagepub.com/en-gb/eur/digital-geographies/book258271), SAGE Publications. ] --- # Everyday digital geographies -- <br/> .LARGE[ - We need to make room for the "everyday" 🍲 ] -- <br/> .LARGE[ - We need mixed *(quantitative + qualitative)* methods 🤝 ] -- <br/> .LARGE[ - We need multi-modal analysis 🤖 🖼 ] --- # Special thanks to... <br/> ...all the amazing researchers that have made the works here presented possible! - [Dr Andrea Ballatore](https://aballatore.space/), King’s College London, University of London - [Dr Katy Bennett](https://www2.le.ac.uk/departments/geography/people/kjb33), University of Leicester - [Dr Zoe Gardner](https://www2.le.ac.uk/departments/geography/people/dr-zoe-gardner), University of Leicester - [Prof Mark Graham](https://www.oii.ox.ac.uk/people/mark-graham/), Oxford Internet Institute, University of Oxford - [Dr Pengyuan Liu](https://ual.sg/authors/pengyuan/), Urban Analytics Lab, National University of Singapore .center[ <img src="https://aballatoreblog.files.wordpress.com/2021/11/andrea-ballatore-2021-turin-v6.jpg" alt="Dr Andrea Ballatore" style="height:200px;"/> <img src="https://www2.le.ac.uk/departments/geography/people/kjb33/dr-katy-bennett-1/katy-bennett" alt="Dr Katy Bennett" style="height:200px;"/> <img src="https://www2.le.ac.uk/departments/geography/people/dr-zoe-gardner/zoegardner250.jpg" alt="Dr Zoe Gardner" style="height:200px;"/> <img src="https://www.oii.ox.ac.uk/wp-content/uploads/2021/07/Mark-Graham-170x170.jpg" alt="Prof Mark Graham" style="height:200px;"/> <img src="https://ual.sg/authors/pengyuan/avatar_hu974b7c91691be02e587e956f017df2b6_176598_270x270_fill_q90_lanczos_center.jpg" alt="Dr Pengyuan Liu" style="height:200px;"/> ] --- class: inverse, center, middle # Digital geographies <span style="color: white">*geographies "of the digital"*</span> -- <span style="color: white"> .small[*rather than "produced through" or "by the digital" (Ash et al., 2018)*] </span> --- # Access Understanding **geographies of access and enablement** provides important insights into the distribution of technologies and services that are essential for digital communication, participation, and representation. <br/> .left-column-large[  ] .right-column-small[ <br/><br/><br/> .referencenote[ Graham, M., De Sabbata, S., and Zook, M. A. (2015) [Towards a study of information geographies: (im)mutable augmentations and a mapping of the geographies of information](https://rgs-ibg.onlinelibrary.wiley.com/action/showCitFormats?doi=10.1002%2Fgeo2.8). Geo: Geography and Environment, 2: 1, 88– 105, doi: 10.1002/geo2.8. ] ] --- # Participation .pull-left[ Participation in knowledge production is also affected by non-geographic biases, which have an effect on geographic data #### OpenStreetMap - 95–98% of all contributions to OSM being produced by men - differences in modes of contributions between men and women ] .pull-right[  ] <br/> .referencenote[ Gardner, Z., Mooney, P., De Sabbata, S. et al. [Quantifying gendered participation in OpenStreetMap: responding to theories of female (under) representation in crowdsourced mapping](https://link.springer.com/article/10.1007/s10708-019-10035-z). GeoJournal 85, 1603–1620 (2020). doi: 10.1007/s10708-019-10035-z ] --- # Representativeness .pull-left[ .large[Representation similar biases as participation] - Higher qualifications strongest factor - Wealth (house prices) strong factor in both, more so for Wikipedia - Twitter strongly influenced by perc. of ppl. aged 30-44 (positively) and households with dependent children (negatively) - Models account only for about 44–55% of variability - Need for more explanatory factors, e.g., tourism-related activities - Twitter and Wikipedia similar but distinct geographies only representative of themselves ] .pull-right[  .referencenote[ Ballatore A., De Sabbata S. (2018) [Charting the Geographies of Crowdsourced Information in Greater London](https://link.springer.com/chapter/10.1007/978-3-319-78208-9_8). In Technologies for All. AGILE 2018. Lecture Notes in Geoinformation and Cartography. Springer, Cham. doi: 10.1007/978-3-319-78208-9_8 ] ] --- # Representativeness .pull-left[ Comparing London and L.A., broadly similar, but each place and platform has its own idiosyncrasies - Affluence has seemingly opposite effects in London and L.A. - Ethnic composition has no explanatory power in London, while presence of white and Asian residents is associated with more data in L.A. - The 30–44 age group makes a clear contribution to data variability in London, but it is not a factor in L.A. - In London, the variability in Wikipedia is linked to up to 49% of that in Twitter, but only up to 6% in L.A. ] .pull-right[  ] .referencenote[ Ballatore, A., & De Sabbata, S. (2020). [Los Angeles as a digital place: The geographies of user‐generated content](https://onlinelibrary.wiley.com/doi/full/10.1111/tgis.12600). *Transactions in GIS, 24(4), 880-902*. ] --- class: inverse, center, middle # Everyday digital geographies --- # Everyday geographies .center[ *Amid the Ridley Scott images of world cities, the writing about skyscraper fortresses, the Baudrillard visions of hyperspace ... most people still live in places like Harlesden or West Brom. Much of life for many people ... still consists of waiting in a bus shelter with your shopping for a bus that never comes.* Massey, D. (1994). Space, Place, and Gender, University of Minnesota Press ] <br/> The importance of the everyday - most of our lives are made up of *"everyday life"* - most of our research focuses on the exceptional - everyday life challenges academic knowledge and what counts as important - everyday interactions - can revel social inequalities and exclusions - can challenge our own methods --- # Mapping multiculture An *(on-going)* mixed-methods exploration of the digital geographies of Leicester .pull-left[ 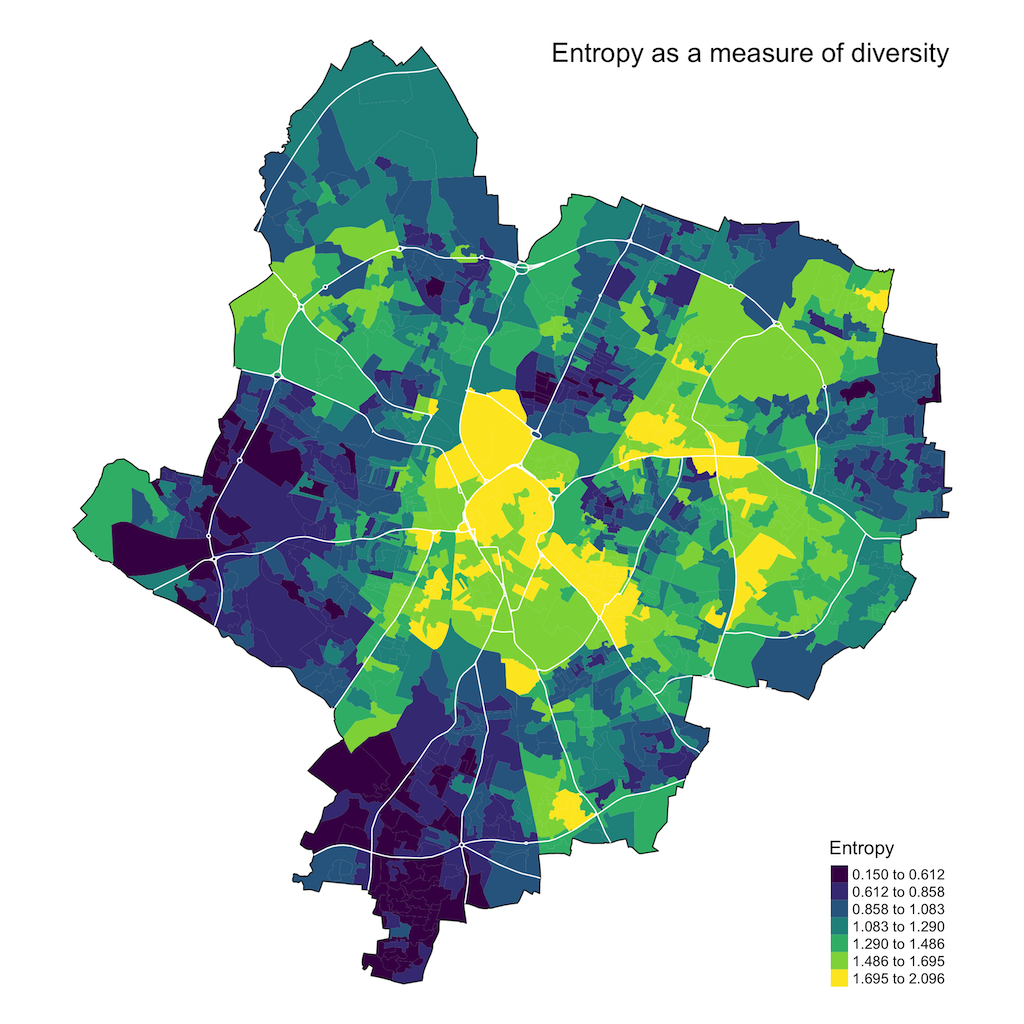 ] .pull-right[ 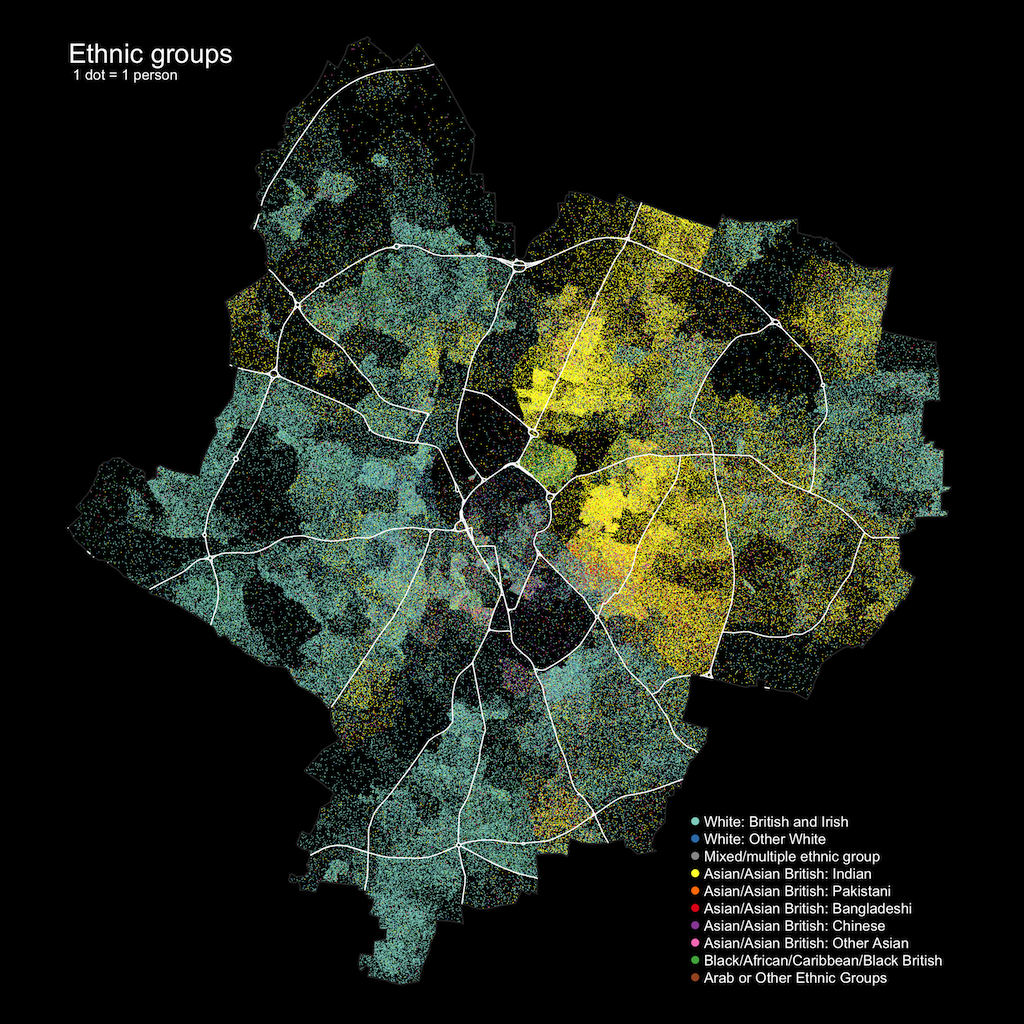 ] --- # Mapping multiculture .pull-left[ <br/> An integrated approach to mixed qualitative and quantitative methods - Digital qualitative methods - Interviews - Qualitative social media analysis - Results from qualitative analysis as a base for quantitative social media analysis - A critical approach to quantitative analysis - A self-reflexive analysis of the process ] .pull-right[ <br/> <br/>  ] --- # Let's go Nando's! .pull-left-large[ Everyday multiculturalism - togetherness that people generate as they go about their everyday lives - how people inhabit diversity in ways that might feel *"good enough"* Qualitative analysis - 391 tweets referencing Nando’s - supported by visualisation and sentiment analysis The analysis showcases - chain restaurants as *"third places"* - attention to uneventfulness - uncivic attention - cultural identification and connection across distance ] .pull-right-small[ 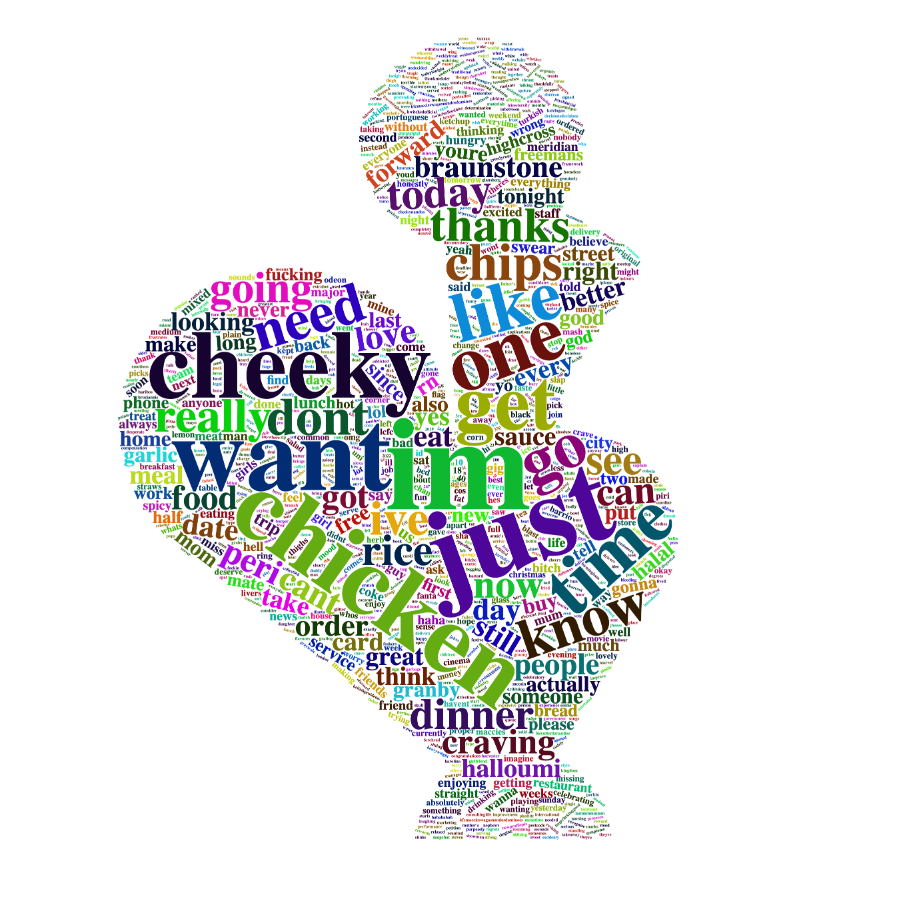 .referencenote[ Katy Bennett, Zoe Gardner & Stefano De Sabbata (2022) [Digital geographies of everyday multiculturalism: ‘Let’s go Nando’s!’](https://doi.org/10.1080/14649365.2022.2065699), Social & Cultural Geography, DOI: [10.1080/14649365.2022.2065699](https://doi.org/10.1080/14649365.2022.2065699) ] ] --- # A mixed-method approach When analysing social media data - **Qualitative** approaches - are nuanced but resource-intensive - can only be reasonably applied to small samples - **Quantitative** approaches - can be applied to vast amounts of data, but they are blunt instruments - are difficult to adapt to specific cases, areas and topics -- - Can a **mixed-method** approach provide a middleground? -- <br/> - Wait... what's the difference? 🤔 -- - Not "objective", generalisable labeling - but subjective, project-specific -- - Is this actually feasible? 😅 --- # Coding emotions - Originally labelled using 50 contexts and 60 emotions -- - then iteratively narrowed down to 8 contexts and 8 emotions .pull-left[ 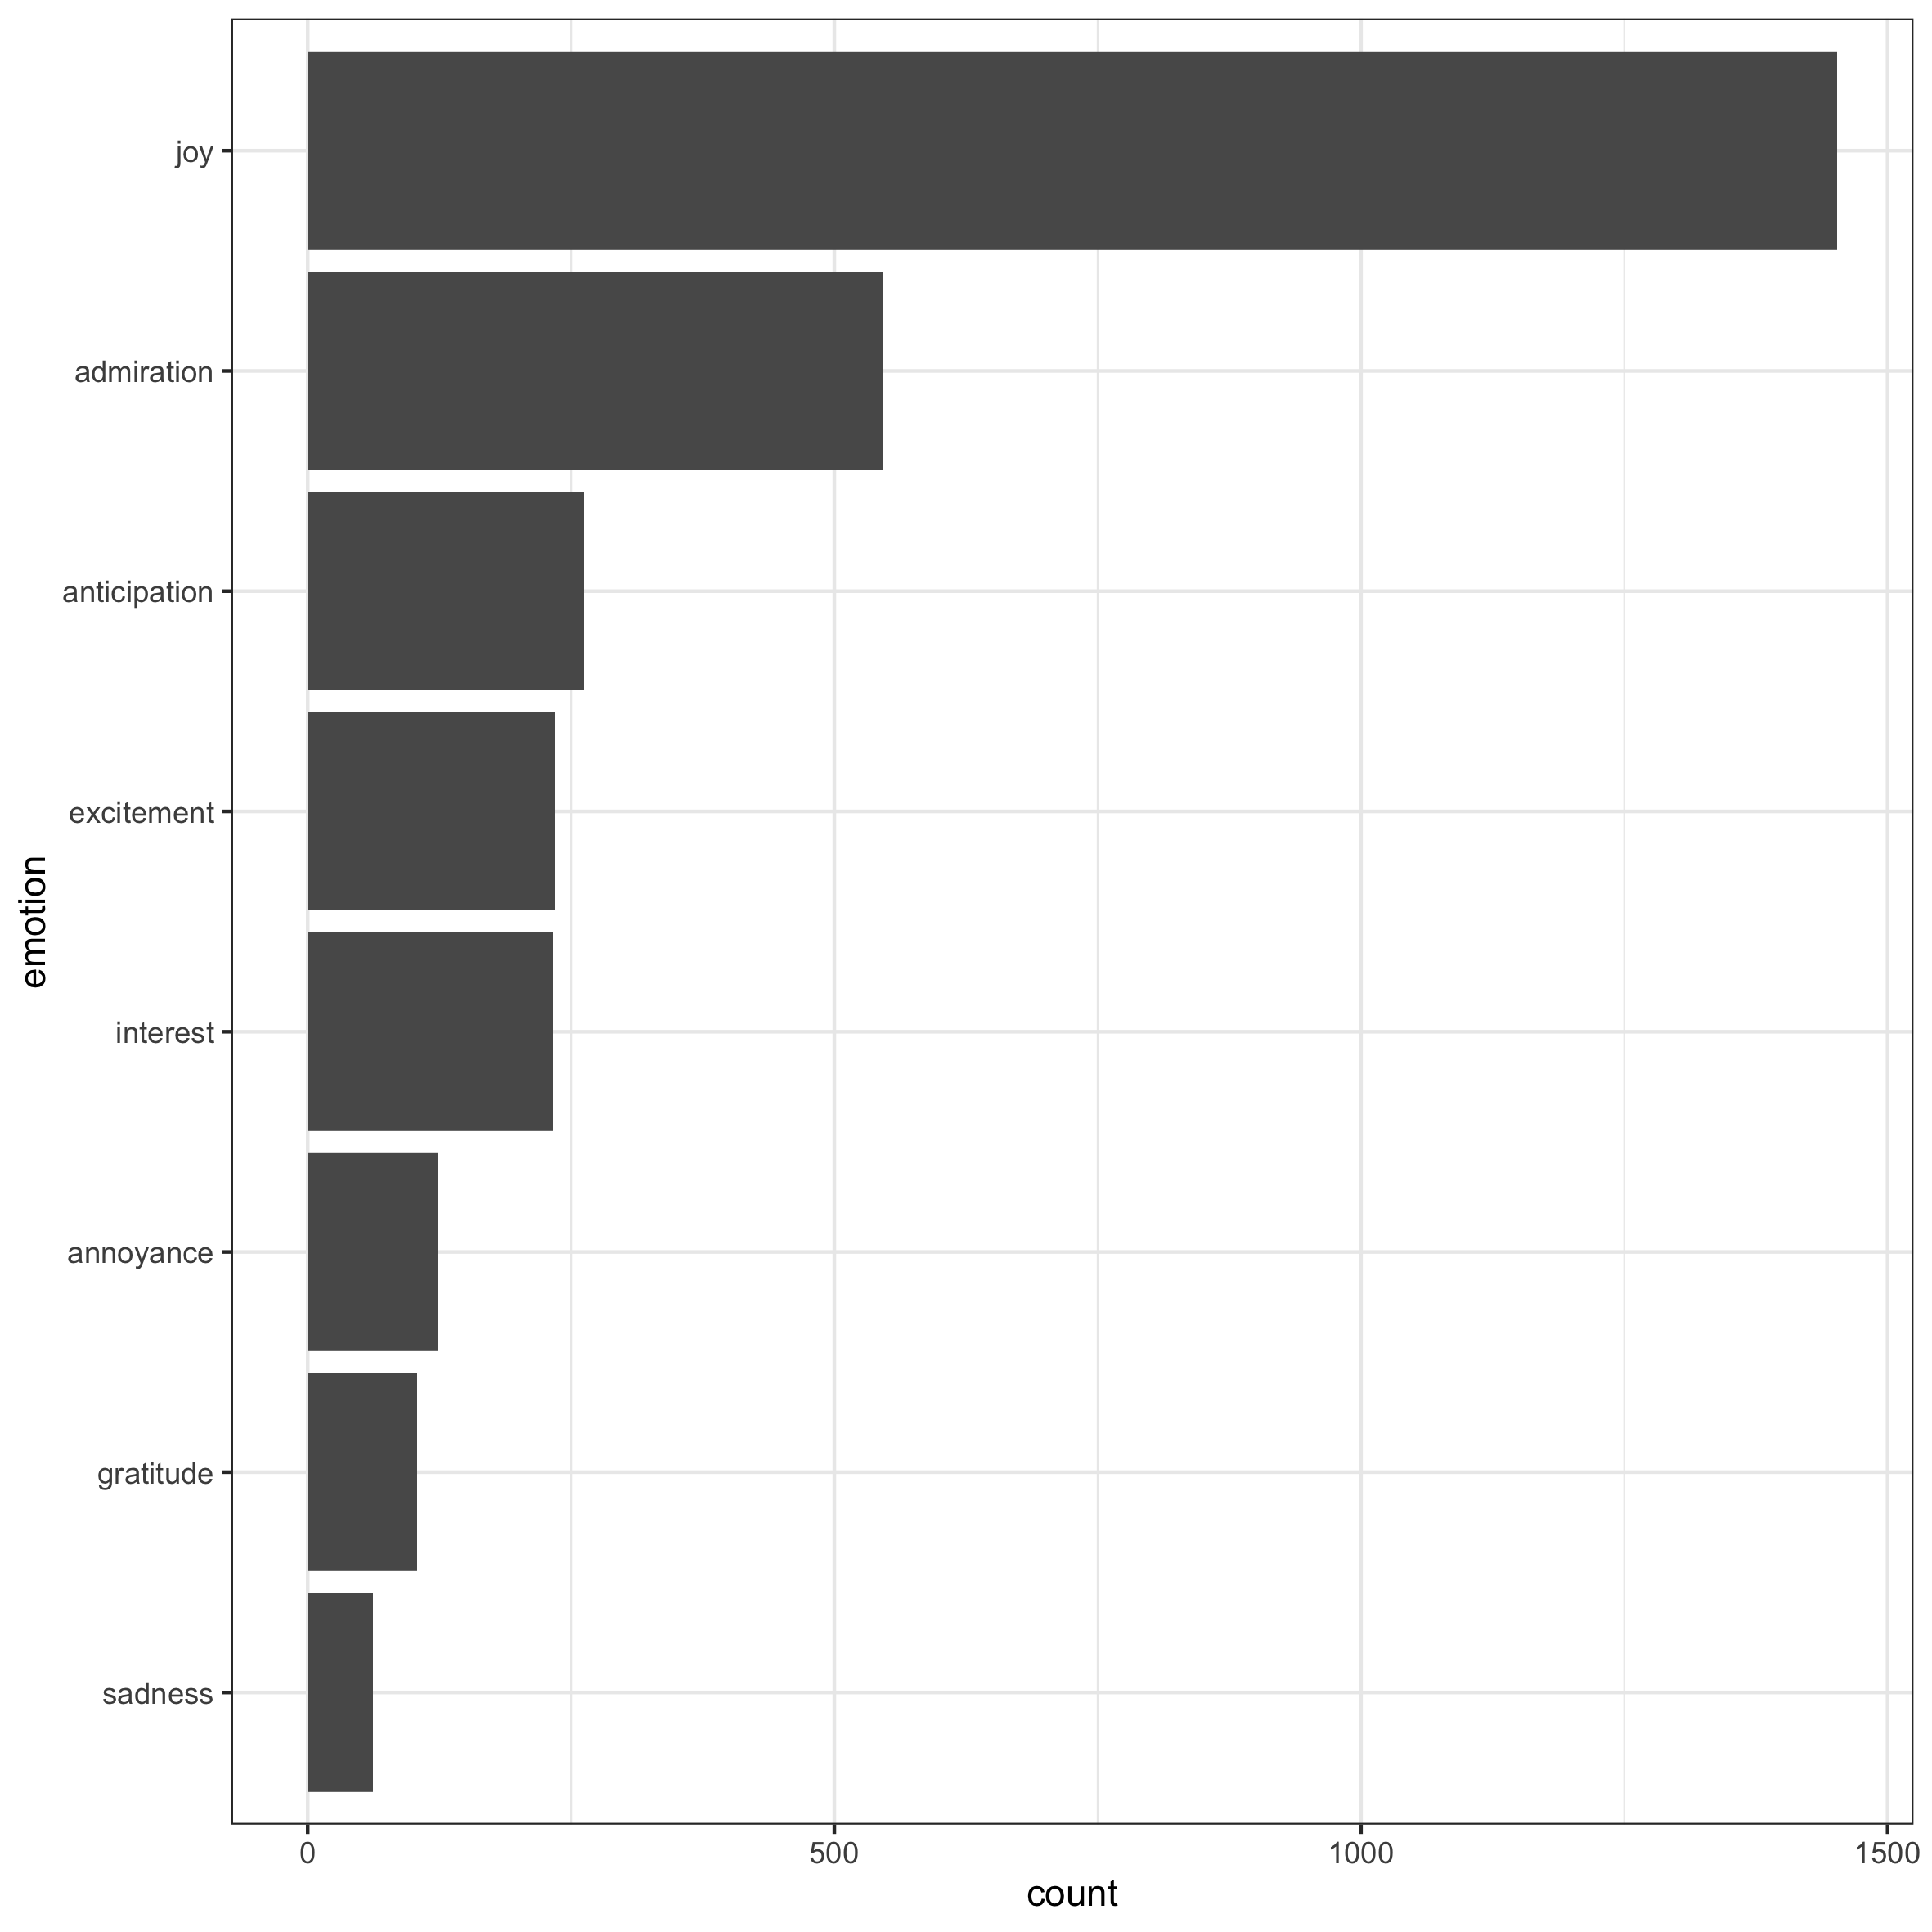 ] .pull-right[ 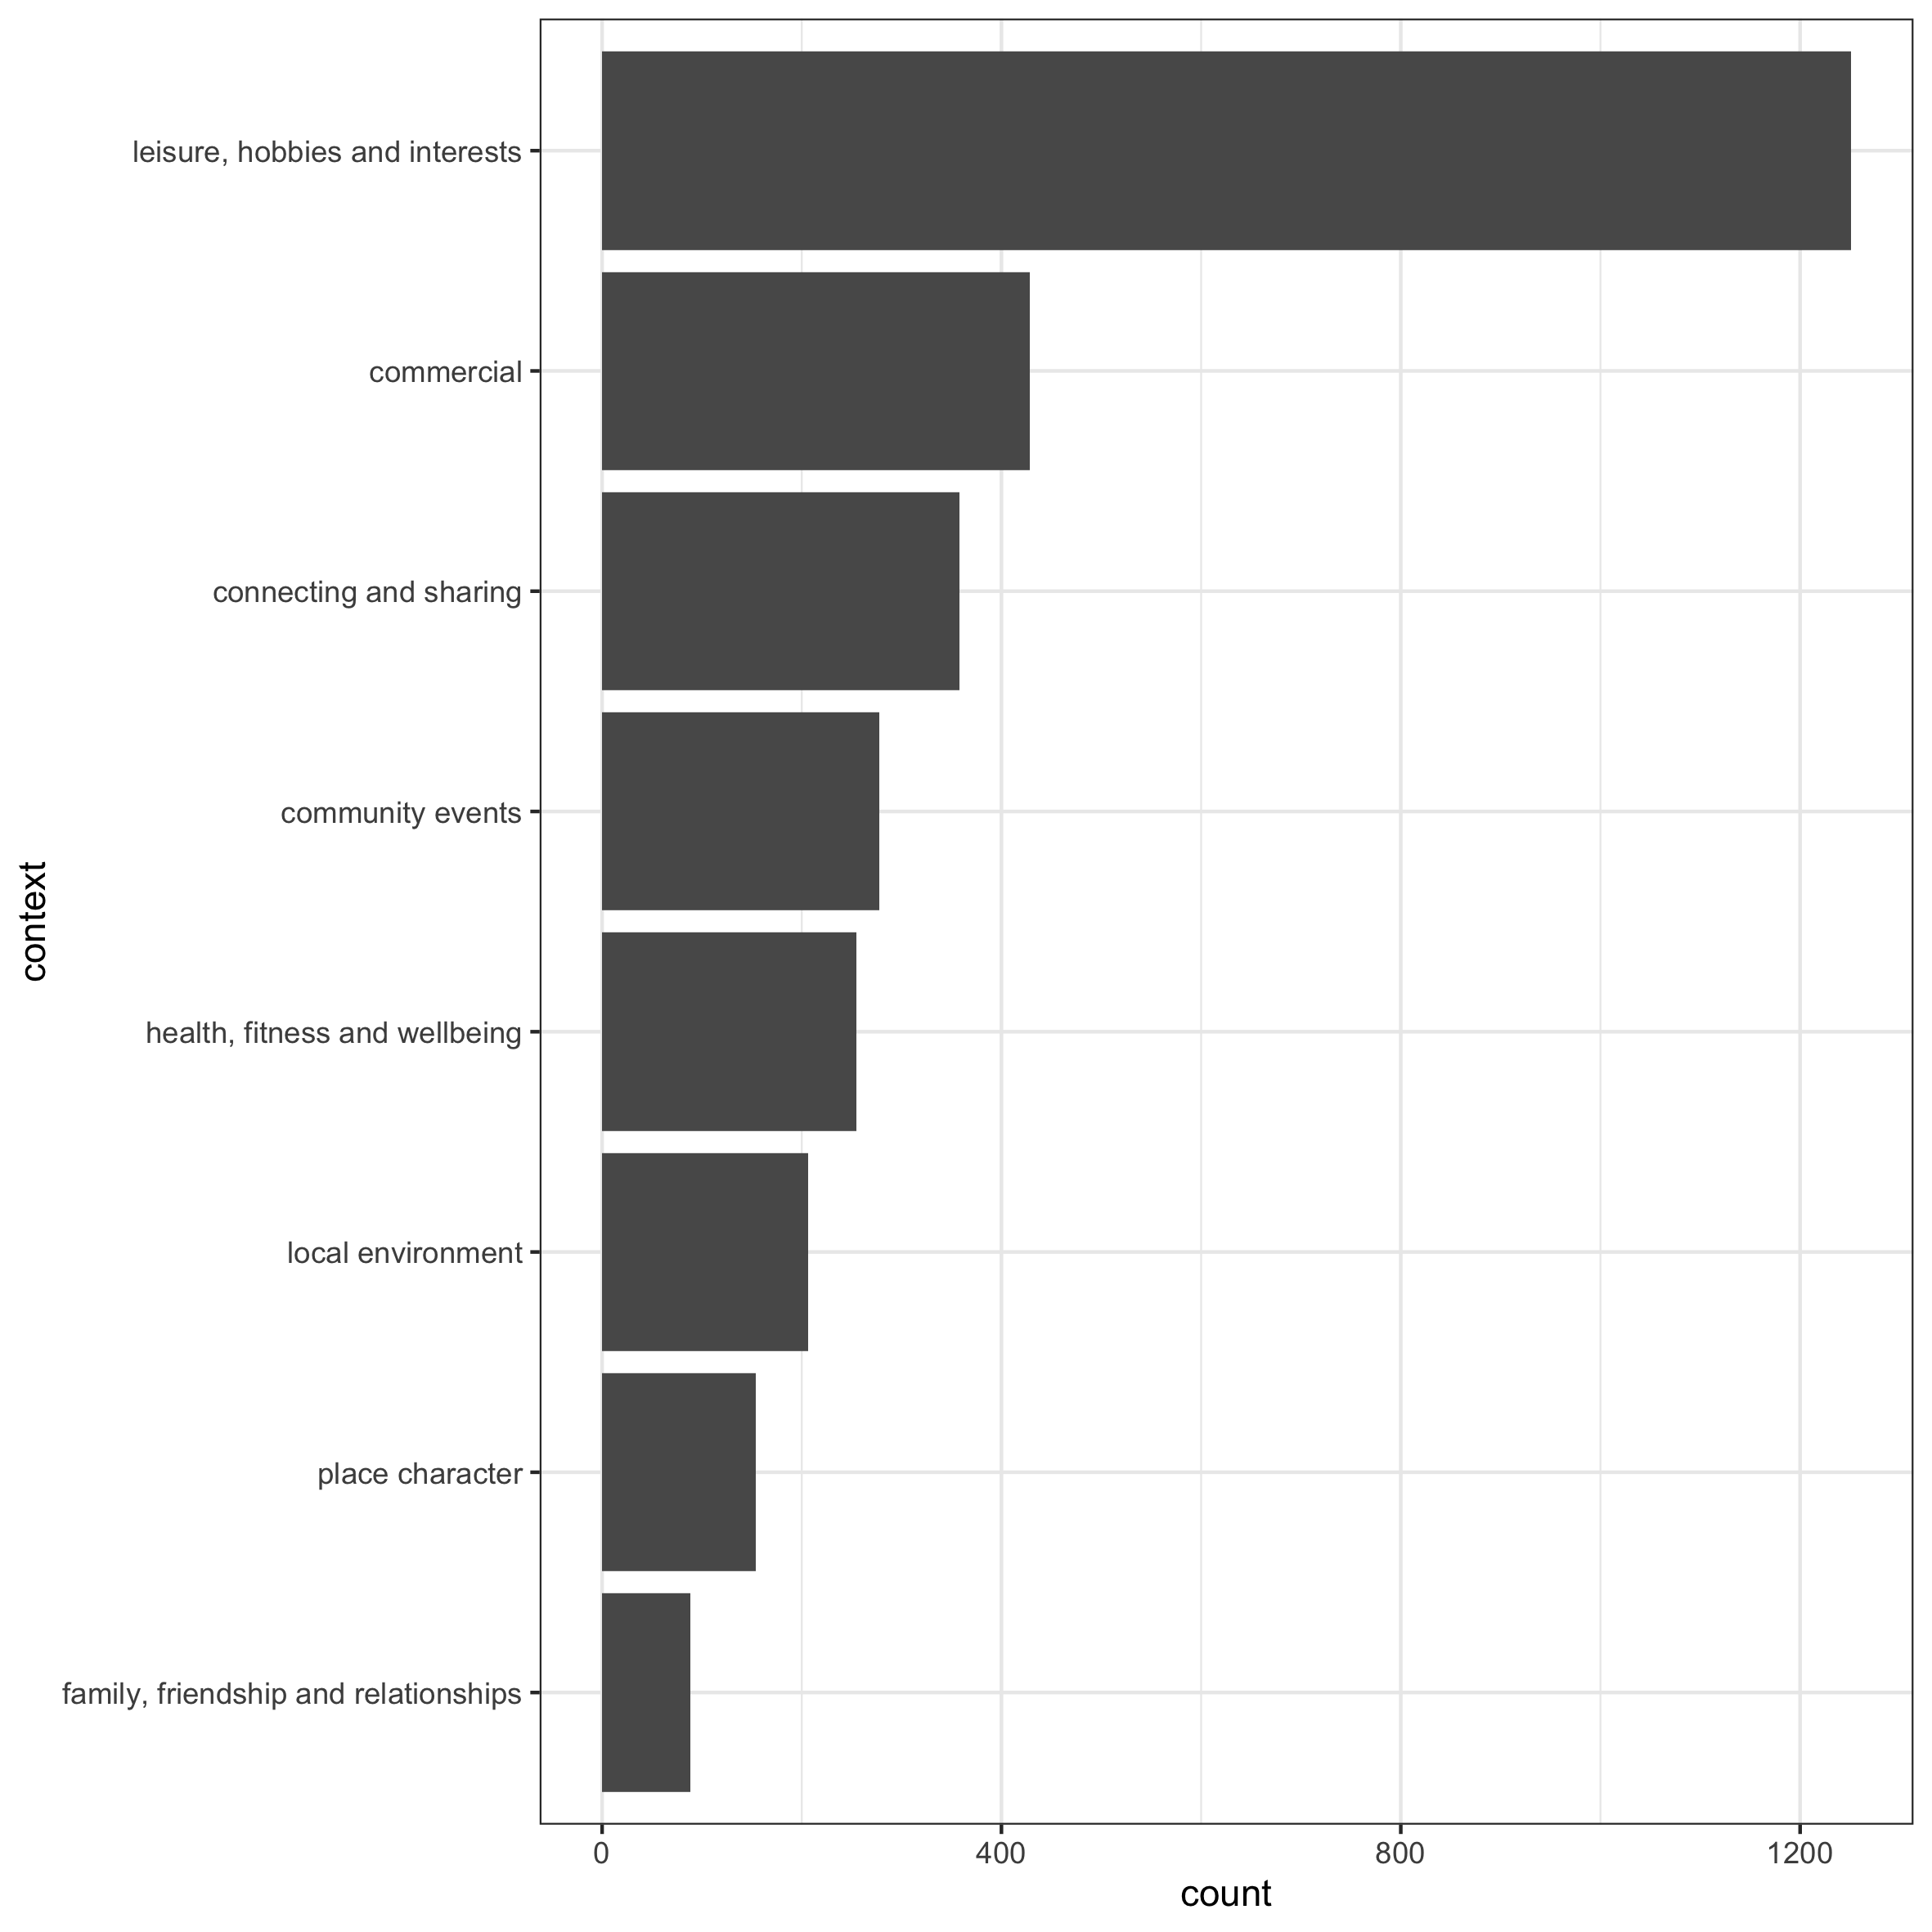 ] --- .pull-left-small[ <br/> <br/> <br/> <br/> <br/> <br/> <br/> <br/> Contexts and emotions seem to be highly correlated ] .pull-right-large[ 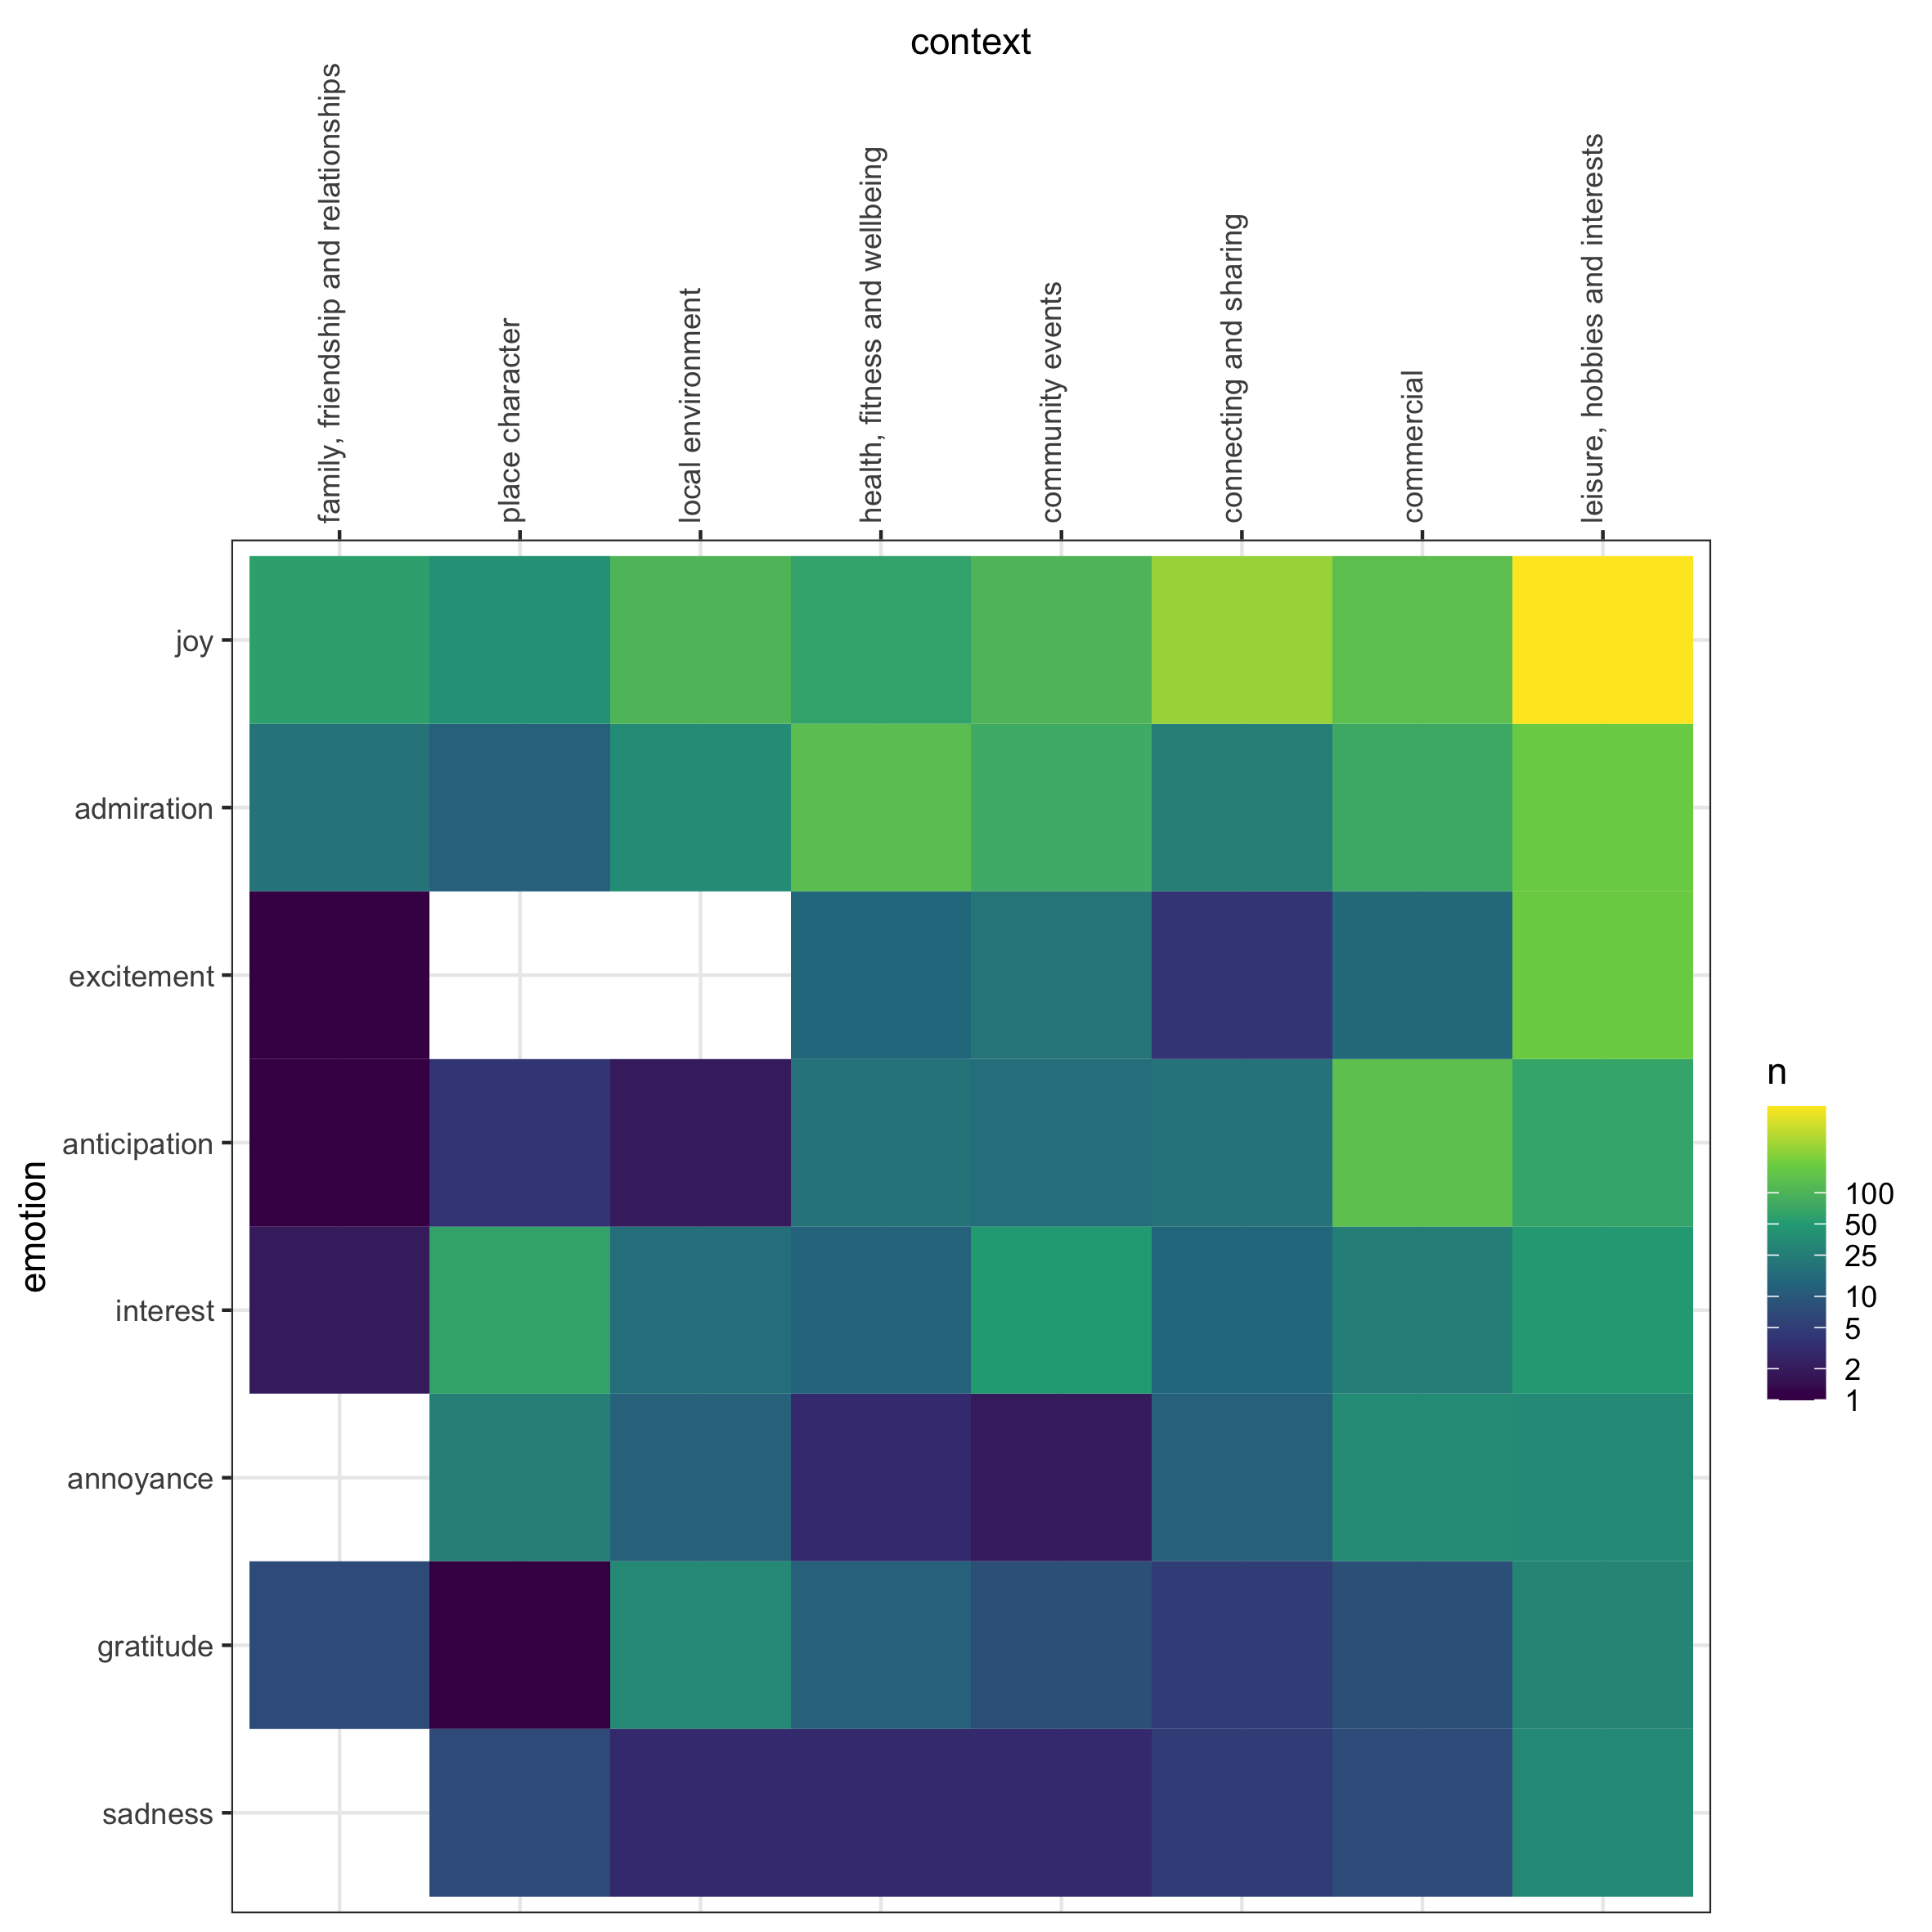 ] --- # Learning emotions Deep-learning text classification model based on pre-trained document transformers ``` (weights): {'admiration': 0.678374655647383, 'annoyance': 2.966867469879518, 'anticipation': 1.4571005917159763, 'excitement': 1.599025974025974, 'gratitude': 3.4683098591549295, 'interest': 1.5585443037974684, 'joy': 0.2636509635974304, 'sadness': 6.480263157894737} Results: - F-score (micro) 0.6277 - F-score (macro) 0.4756 - Accuracy 0.6277 By class: precision recall f1-score support joy 0.6805 0.8647 0.7616 133 admiration 0.6154 0.4615 0.5275 52 interest 0.5455 0.5217 0.5333 23 anticipation 0.5000 0.4167 0.4545 24 excitement 0.4286 0.2727 0.3333 22 annoyance 0.6250 0.4167 0.5000 12 gratitude 0.5000 0.4000 0.4444 10 sadness 0.5000 0.1667 0.2500 6 micro avg 0.6277 0.6277 0.6277 282 macro avg 0.5494 0.4401 0.4756 282 weighted avg 0.6098 0.6277 0.6070 282 samples avg 0.6277 0.6277 0.6277 282 ``` --- # Predicting emotions Text classification model used to predict the emotion of 849,988 tweets .center[ 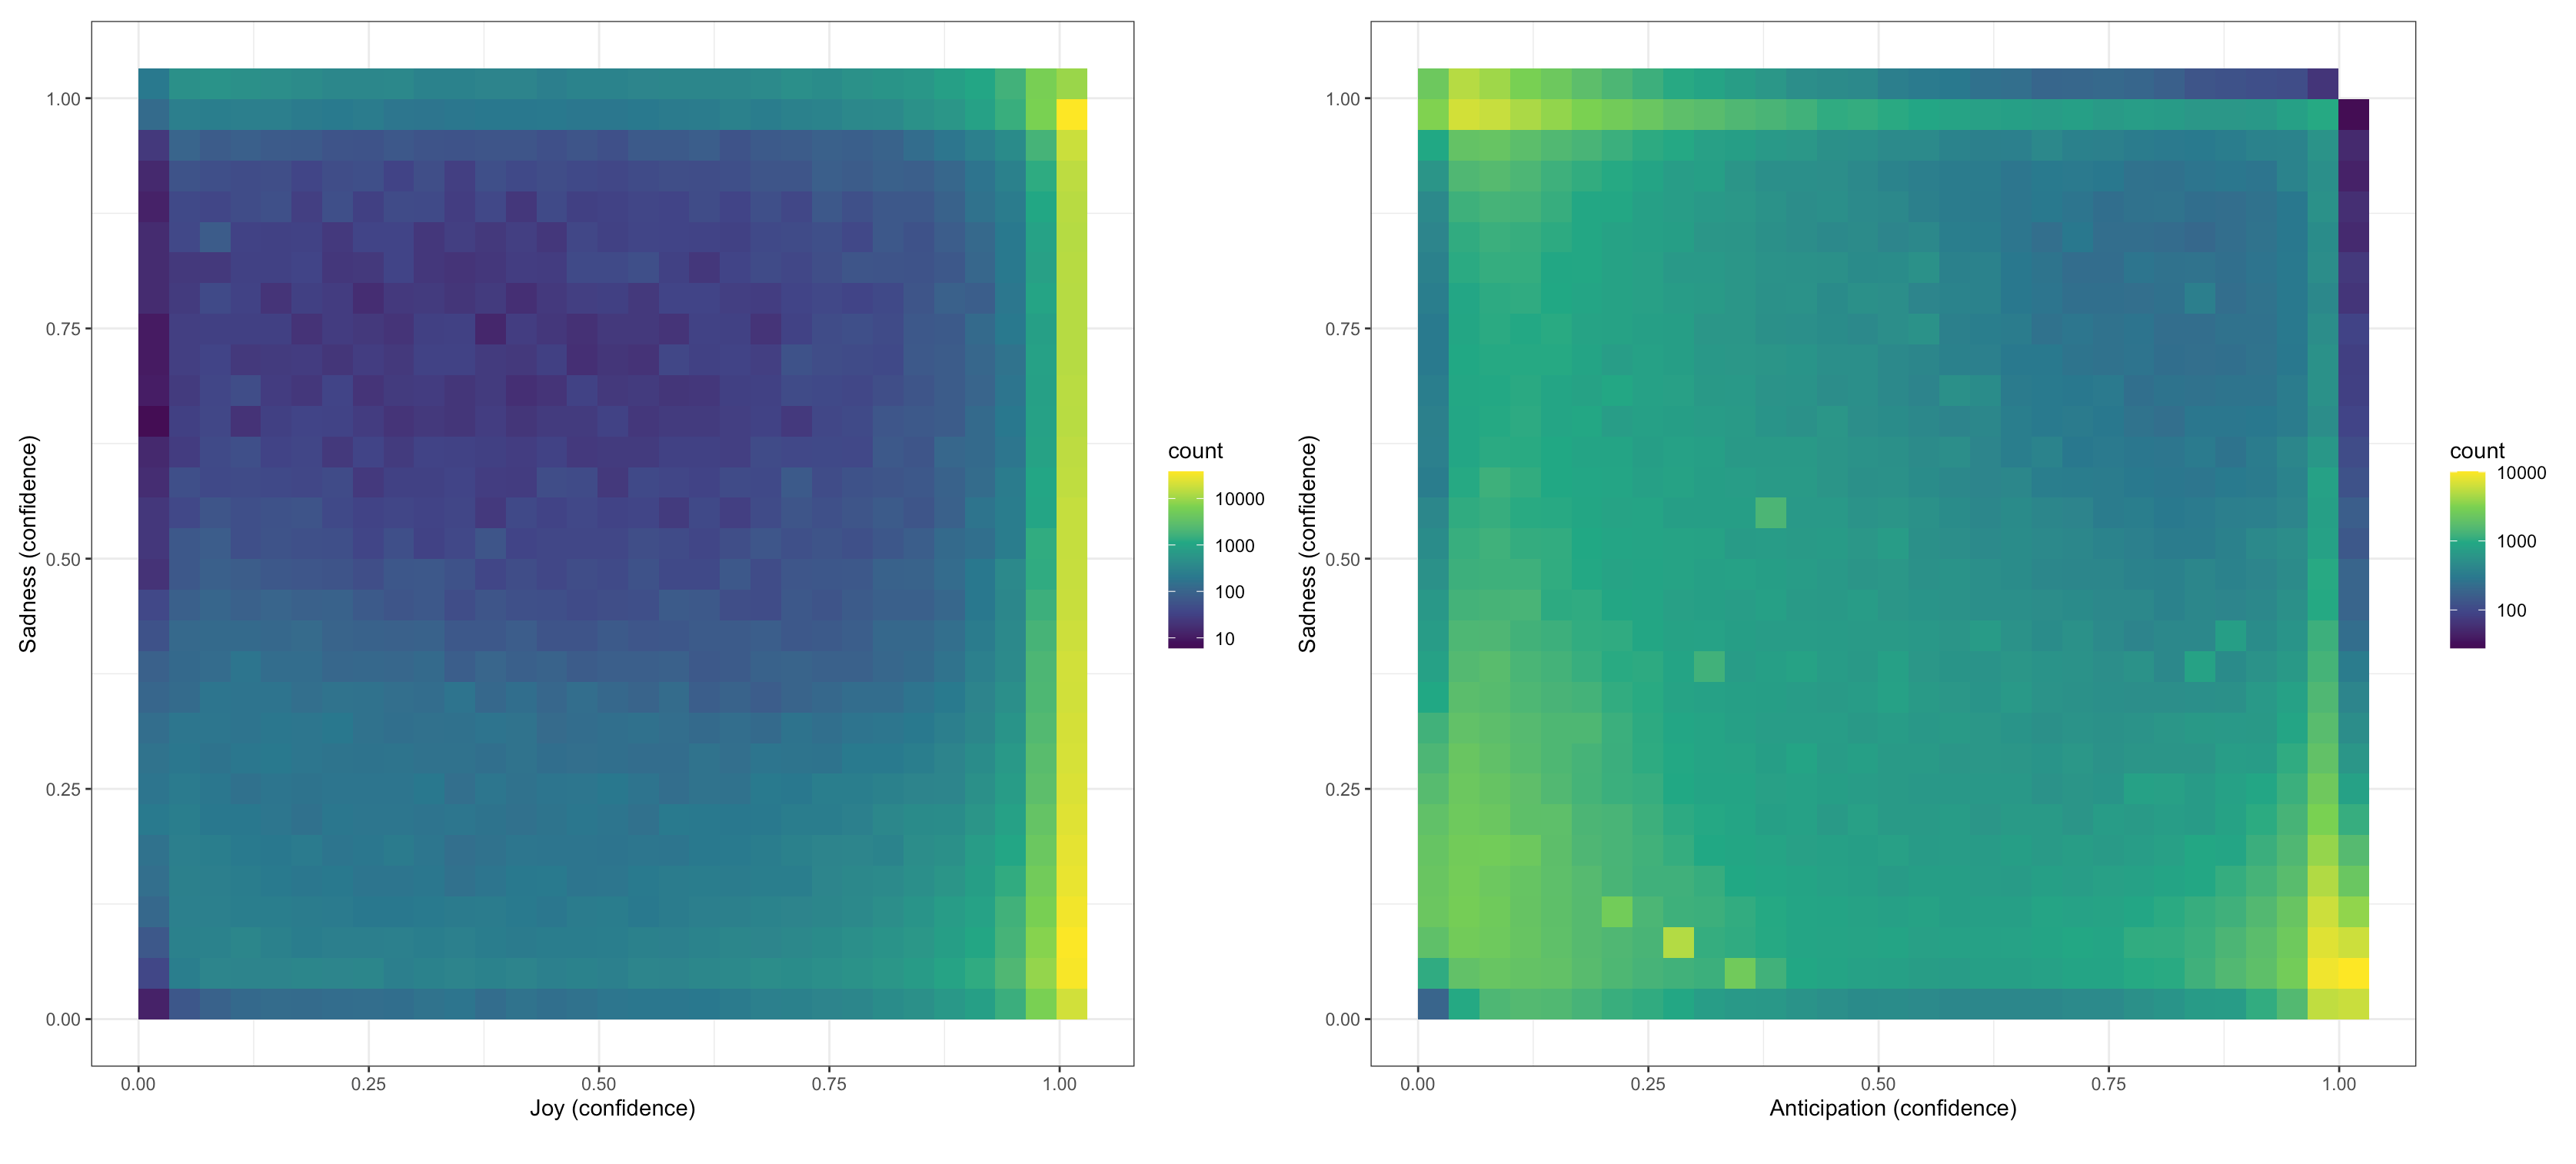 ] --- class: inverse, center, middle # Beyond the text --- # Beyond the text Can we combine the nuance of qualitative analysis with the scalability of quantitative analysis into a combined mixed-method approach? A semi-supervised neural network might be the way forward... .center[  ] .referencenote[ Liu, P. and De Sabbata, S., 2021. [A graph-based semi-supervised approach to classification learning in digital geographies](https://www.sciencedirect.com/science/article/pii/S0198971520303161). Computers, Environment and Urban Systems, 86, p.101583. doi: 10.1016/j.compenvurbsys.2020.101583 ] --- # Multimodal autoencoder + GCNN Combine - image representations - similar to a Residual Neural Network (ResNet, see Mao et al., 2016) - text representations - Long Short-Term Memory Neural Network (LSTM) - to a combined representation - similar to a Correlational Neural Network (Corrnet, see Chandar et al., 2016) - minimise self-construction error - minimise cross-reconstruction error from image and texts - maximise correlation between hidden representations of both components The encoded features are used as input for a Graph Convolutional Neural Network (GCNN) - nodes represent tweets, link weight encode proximity - learning labels *"locally"* using a semi-supervised approach .referencenote[ Liu, P. and De Sabbata, S., 2021. [A graph-based semi-supervised approach to classification learning in digital geographies](https://www.sciencedirect.com/science/article/pii/S0198971520303161). Computers, Environment and Urban Systems, 86, p.101583. doi: 10.1016/j.compenvurbsys.2020.101583 ] --- # Deep learning, spatio-temporally .pull-left[ <br/> 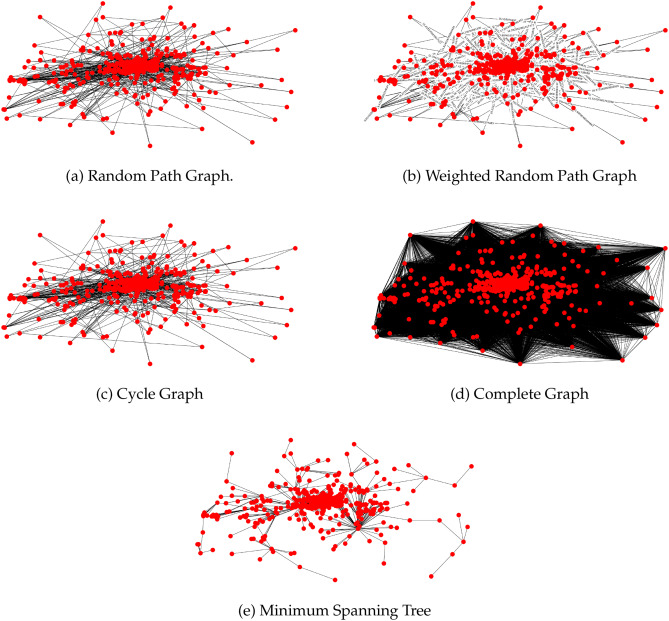 ] .pull-right[ <br/> 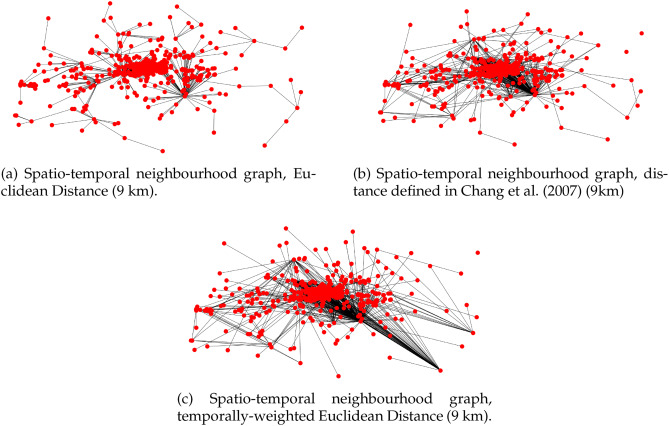 .referencenote[ Liu, P. and De Sabbata, S., 2021. [A graph-based semi-supervised approach to classification learning in digital geographies](https://www.sciencedirect.com/science/article/pii/S0198971520303161). Computers, Environment and Urban Systems, 86, p.101583. doi: 10.1016/j.compenvurbsys. 2020.101583 ] ] --- # Deep learning, spatio-temporally Results of the experiments using a Minimum Spanning Tree (3 km left, 4 km right) .pull-left[ 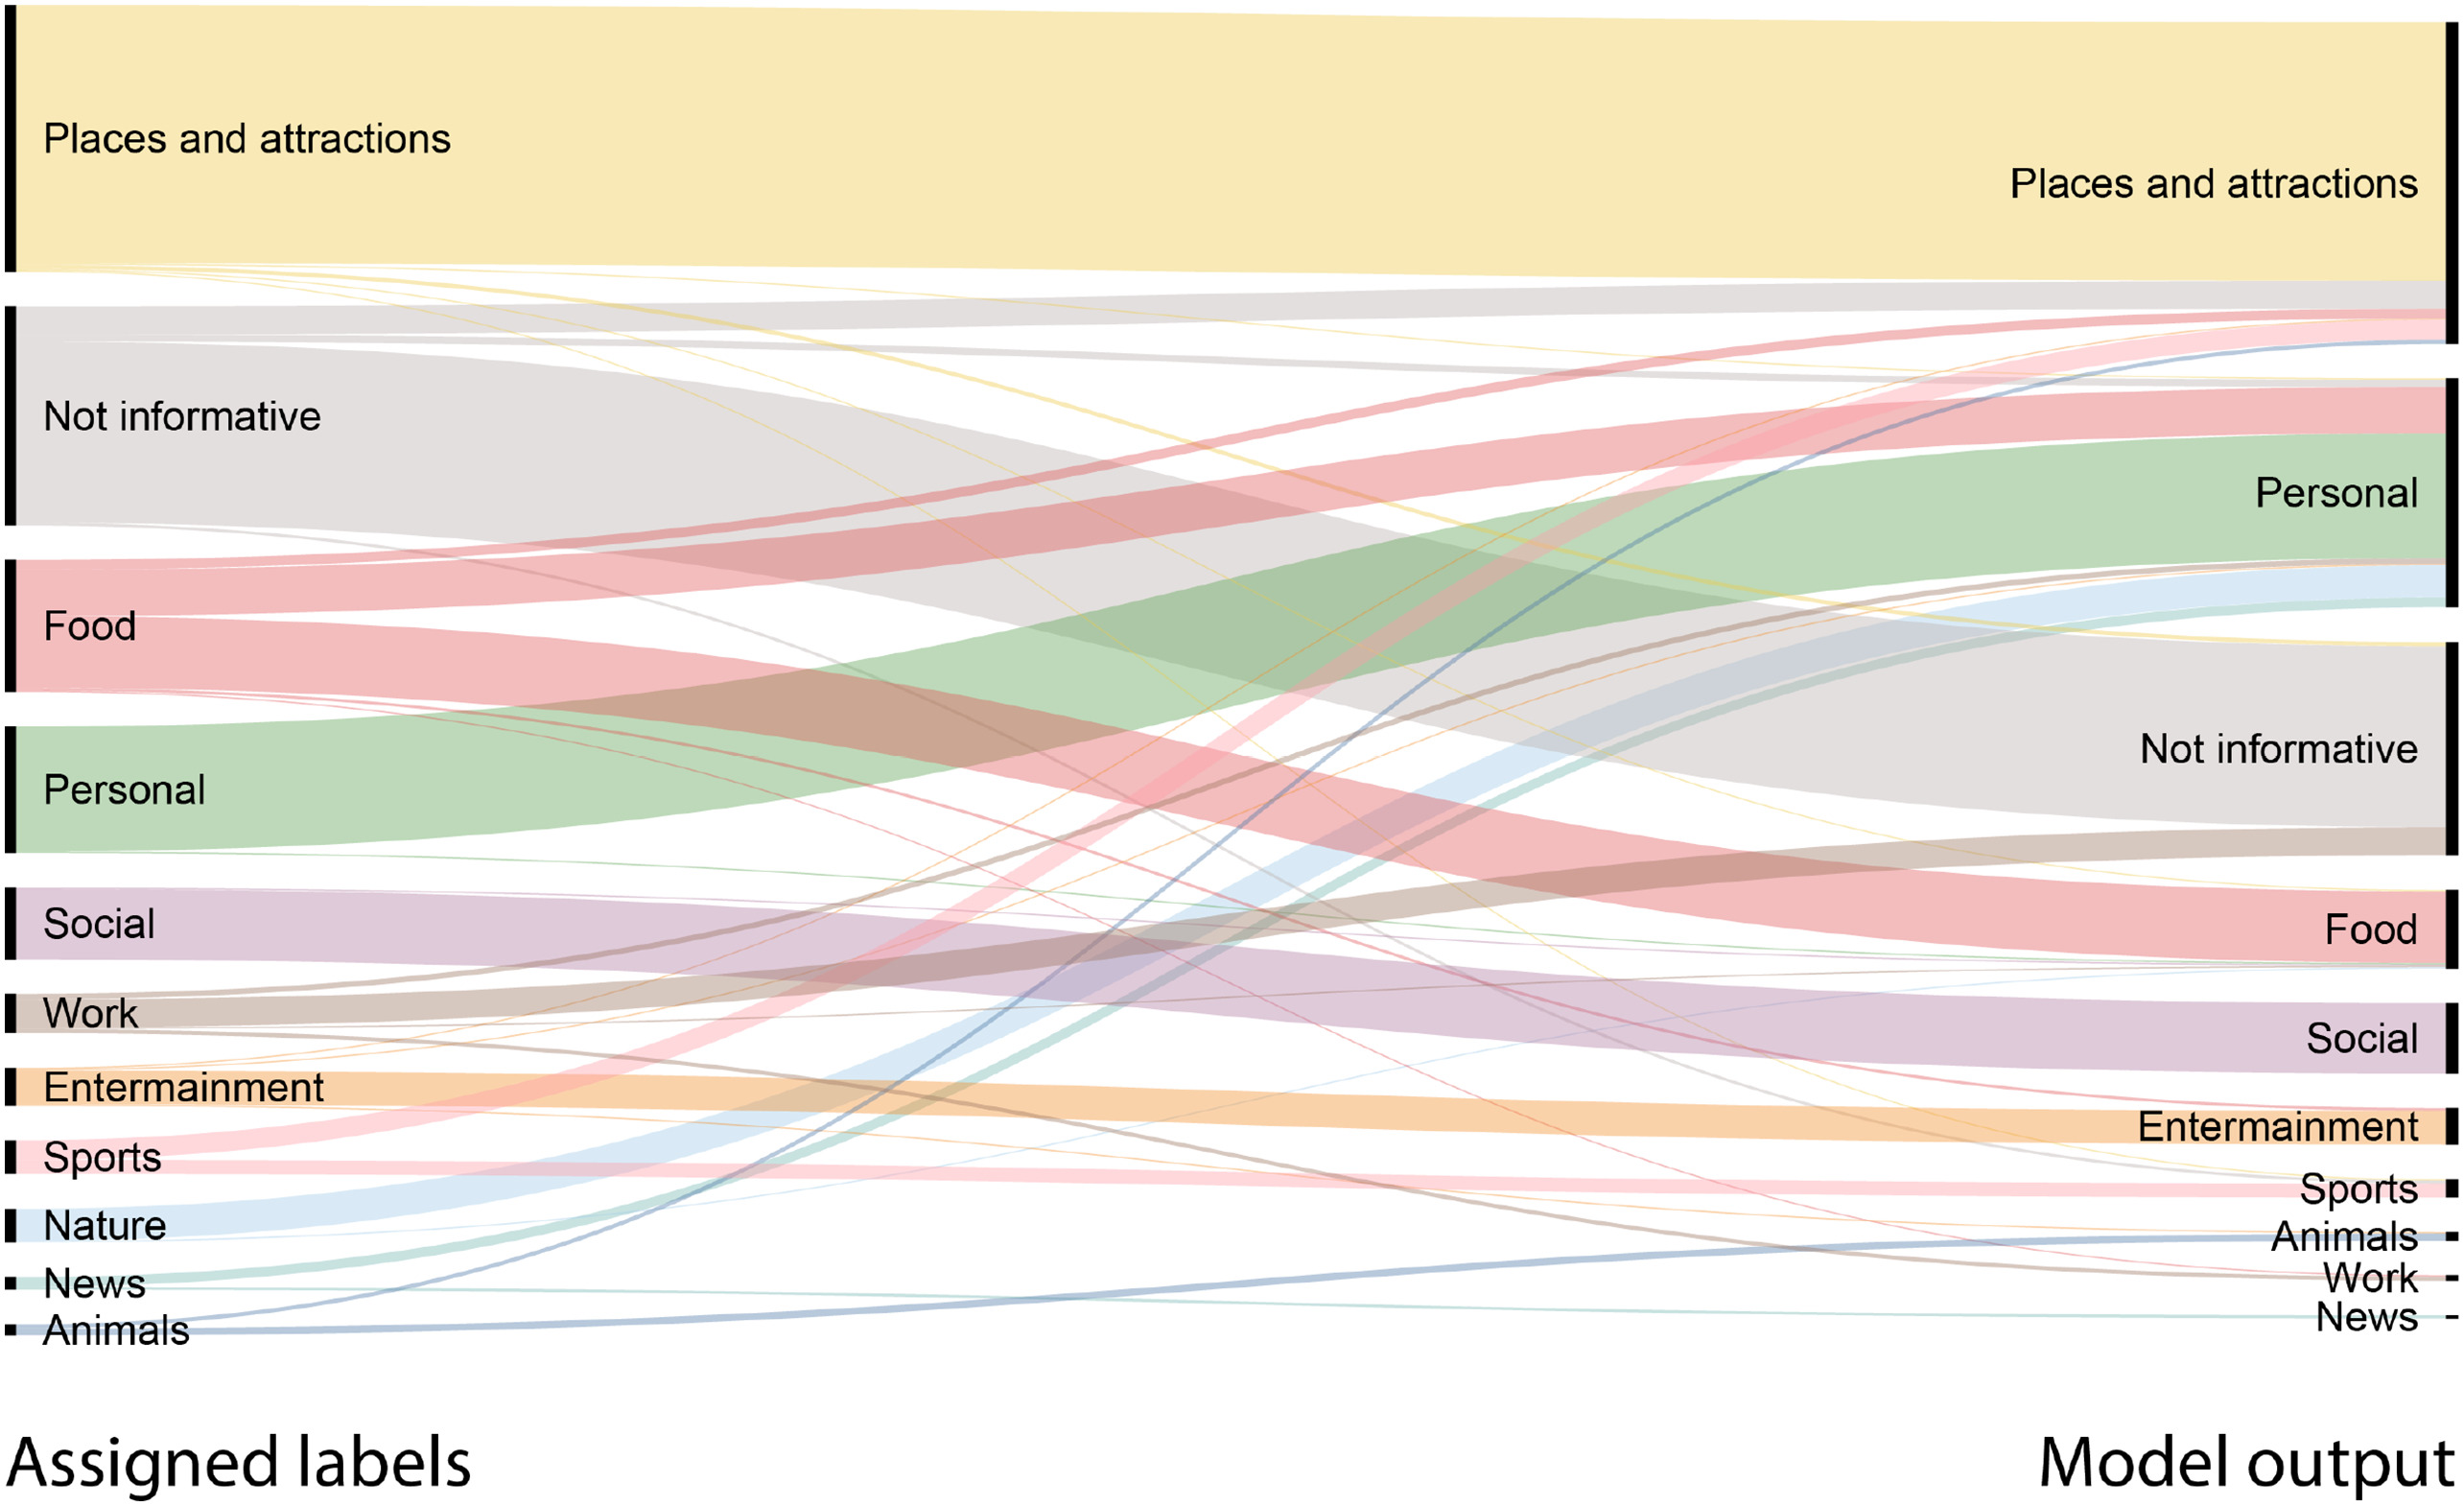 .referencenote[ Liu, P. and De Sabbata, S., 2021. [A graph-based semi-supervised approach to classification learning in digital geographies](https://www.sciencedirect.com/science/article/pii/S0198971520303161). Computers, Environment and Urban Systems, 86, p.101583. doi: 10.1016/j.compenvurbsys.2020.101583 ] ] .pull-right[ 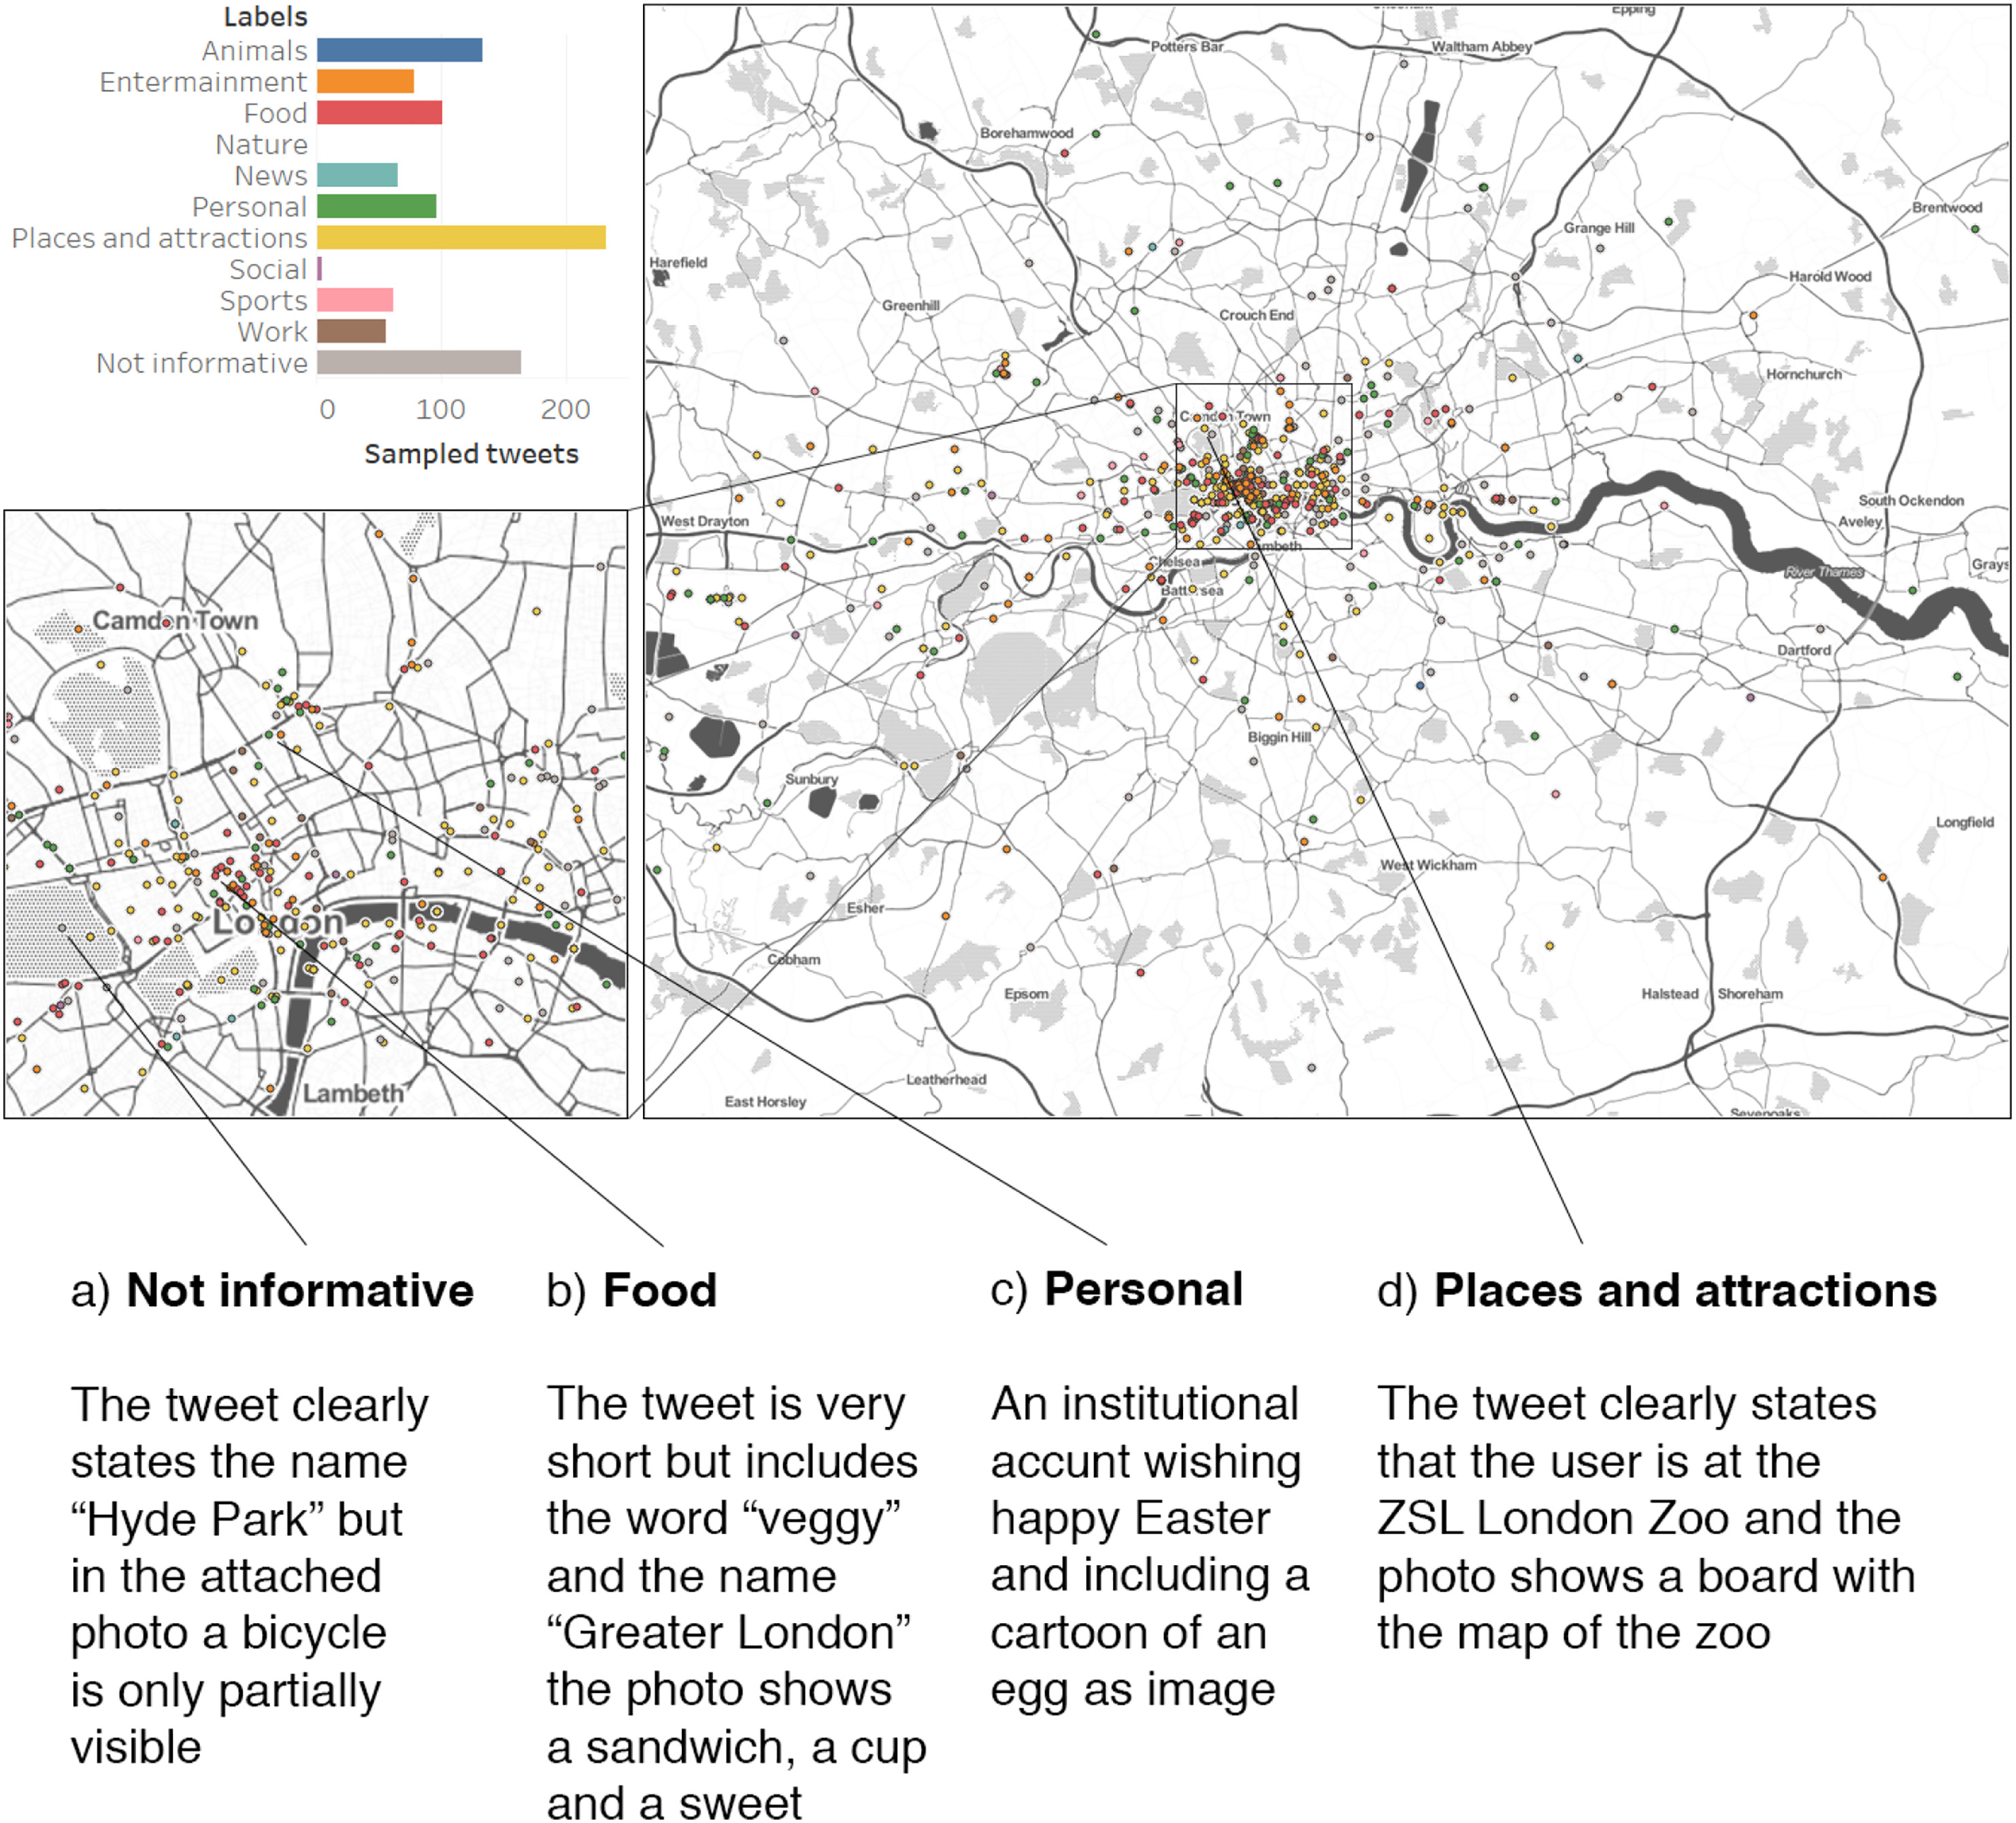 ] --- # Deep learning, spatio-temporally Ultimately, our results illustrate the advantages (necessity?) of understanding geo-located social media posts as geographic events | Model input | Representation Extractor | Model | Accuracy | Micro-F1 Score | |--------------------------------------|--------------------------|-------------------------------------------|----------|----------------| | A-spatial with Images and Text | Multi-modal Autoencoder | SVM (no graph structure) | 15.87% | 9.13% | | A-spatial with Images and Text | Multi-modal Autoencoder | GCN (Cycle Graph) | 68.63% | 65.94% | | Spatial with Images and text | Multi-modal Autoencoder | GCN (Weighted MST (3 km)) | 73.57% | 72.89% | | Spatio-temporal with Images and text | Multi-modal Autoencoder | GCN (StN (temporally-weighted, 4 km)) | 78.98% | 76.72% | | Spatio-temporal with Images and text | Multi-modal Autoencoder | GCN (StN (distance-temp.-weighted, 4 km)) | 80.08% | 78.65% | --- class: inverse, center, middle # Conclusions --- # Take home messages .large[ - We need to make room for the "everyday" 🍲 - everyday interactions can revel new aspects of social interactions - but are much more challenging to handle algorithmically ] -- .large[ - We need mixed *(quantitative + qualitative)* methods 🤝 - to render our exploration of the everyday meaningful ] -- .large[ - We need multi-modal analysis 🤖 🖼 - to improve our (algorithmic) understanding of content ] -- .large[ … but, beware … ] .large[ - Mixed methods require dialogue 🙈 🙉 🙊 - *Off the shelf* doesn't necessarily mean *ready to use* 🛠 - Don't follow all the white rabbits 🐰 🐰 🐰 ] --- class: bottom background-image: url(images/mina-catching-the-snow.png) background-size: cover # Thanks! <br/> <br/> <br/> <br/> <br/> Slides created via the R package [**xaringan**](https://github.com/yihui/xaringan). The chakra comes from [remark.js](https://remarkjs.com), [**knitr**](https://yihui.org/knitr), and [R Markdown](https://rmarkdown.rstudio.com). --- # Contacts and acknowledgements <br/> .bottom[ .pull-left[ .large[Get in touch!] 👋😊 - Email me at [s.desabbata@le.ac.uk](mailto:s.desabbata@le.ac.uk) - [sdesabbata.github.io](http://sdesabbata.github.io/) is my website You can find me - [@maps4thought](https://twitter.com/maps4thought) on Twitter - [sdesabbata](https://github.com/sdesabbata) on GitHub - As well as on - [ResearchGate](https://www.researchgate.net/profile/Stefano-De-Sabbata) - [Academia.edu](https://leicester.academia.edu/StefanoDeSabbata) - [Google Scholar](https://scholar.google.com/citations?user=VcSXvCYAAAAJ&hl=en) - [LinkedIn](https://www.linkedin.com/in/stefanodesabbata/?originalSubdomain=uk) ] .pull-right[ .center[] .referencenote[ Images, maps and results included in these slides contain public sector information from Office for National Statistics and Ordnance Survey licensed under the [Open Government Licence v3.0](http://www.nationalarchives.gov.uk/doc/open-government-licence). Data from the [GH Archive](https://www.gharchive.org/) under [CC-BY-4.0](https://creativecommons.org/licenses/by/4.0/), [OpenStreetMap](OpenStreetMap), under [ODbL](http://www.openstreetmap.org/copyright), [Twitter](https://twitter.com/) under the [Developer Agreement](https://developer.twitter.com/en/developer-terms/agreement), [Wikipedia](https://en.wikipedia.org/wiki/Main_Page) under [CC BY 3.0](https://creativecommons.org/licenses/by/3.0/) and the the [World Bank Open Data](https://data.worldbank.org/) portal under [CC-BY-4.0](https://creativecommons.org/licenses/by/4.0/). Map tiles by [Stamen Design](http://maps.stamen.com/#toner/12/37.7706/-122.3782), under [CC BY 3.0](https://creativecommons.org/licenses/by/3.0/). ] ] ] --- class: hide-count count: false # Multimodal autoencoder Combine - image representations - similar to a Residual Neural Network (ResNet, see Mao et al., 2016) - text representations - Long Short-Term Memory Neural Network (LSTM) - to a combined representation - similar to a Correlational Neural Network (Corrnet, see Chandar et al., 2016) - minimise self-construction error - minimise cross-reconstruction error from image and texts - maximise correlation between hidden representations of both components `$$\mathcal{J}_{\mathcal{Z}} = \sum^{N}_{i=1}(L(z_{i},g(h(z_{i})))+L(z_{i},g(h(x_{i})))+L(z_{i},g(h(y_{i}))))-\lambda corr(h(X),h(Y))$$` `$$corr(h(X),h(Y)) = \frac{\sum^{N}_{i=1}(h(x_{i}-\overline{h(X)})(h(y_{i}-\overline{h(Y)}))}{\sqrt{(\sum^{N}_{i=1}(h(x_{i}-\overline{h(X)})^{2}(\sum^{N}_{i=1}(h(y_{i}-\overline{h(Y)})^{2}}}$$` --- class: hide-count count: false # Graph Convolutional Network Node-level output: `\(Z = f(X,A) = \textit{softmax}(H^{(L)})\)` `\(X\)` is information from autoencoder for each post, `\(A\)` is graph adjacency matrix Layer-wise propagation rule for GCN: `\(H^{(L+1)} = \sigma(\hat{D}^{-\frac{1}{2}}\hat{A}\hat{D}^{-\frac{1}{2}}H^{(L)}W^{(L)})\)` - `\(\hat{A}=A+I_N\)` and `\(I_N\)` is the identity matrix of `\(A\)` - `\(W^{(L)}\)` is the trainable weight matrix of `\(L\)`th layer of neural network `\(\hat{D}_{ii} = \sum_j\hat{A}_{ij}\)` - `\(\sigma(\cdot)\)` is a non-linear activation, using `\(ReLu(\cdot) = max(0,\cdot)\)` - `\(H^{(L)}\)` is the activation matrix for the `\(L\)`th layer - `\(H^{(0)}=X\)` - `\(H^{(L)}=\hat{A}ReLu(H^{(L-1)})W^{(L)}\)`. Cross-entropy error: `\(\mathcal{L}=-\sum_{l\in \mathcal{Y}_{L}}\sum_{f=1}^{F}\mathcal{Y}_{lf}\ln{Z_{lf}}\)` - `\(\mathcal{Y}_L\)` is the set of nodes that have labels.