31 Data visualisation
31.1 Visual variables
A visual variable is an aspect of a mark that can be controlled to change its appearance.
Visual variables include:
- Size
- Shape
- Orientation
- Colour (hue)
- Colour value (brightness)
- Texture
- Position (2 dimensions)
31.2 Grammar of graphics
Grammars provide rules for languages
“The grammar of graphics takes us beyond a limited set of charts (words) to an almost unlimited world of graphical forms (statements)” (Wilkinson, 2005)
Statistical graphic specifications are expressed in six statements:
- Data manipulation
- Variable transformations (e.g., rank),
- Scale transformations (e.g., log),
- Coordinate system transformations (e.g., polar),
- Element: mark (e.g., points) and visual variables (e.g., color)
- Guides (axes, legends, etc.).
31.3 ggplot2
The ggplot2 library offers a series of functions for creating graphics declaratively, based on the Grammar of Graphics.
To create a graph in ggplot2:
- provide the data
- specify elements
- which visual variables (
aes) - which marks (e.g.,
geom_point)
- which visual variables (
- apply transformations
- guides
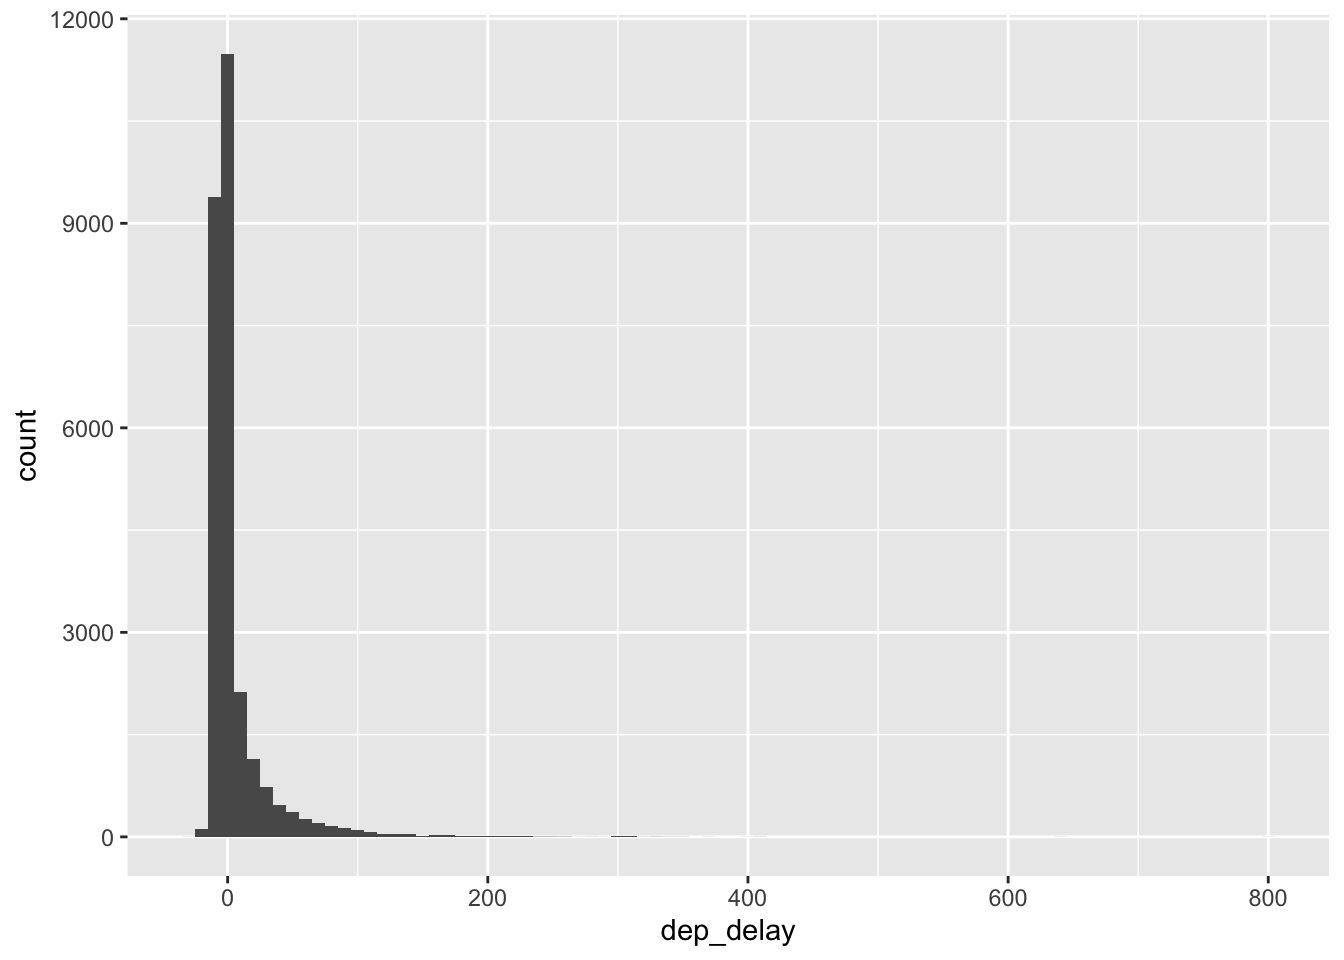
31.4 Histograms
xvariable to plotgeom_histogram
31.5 Histograms
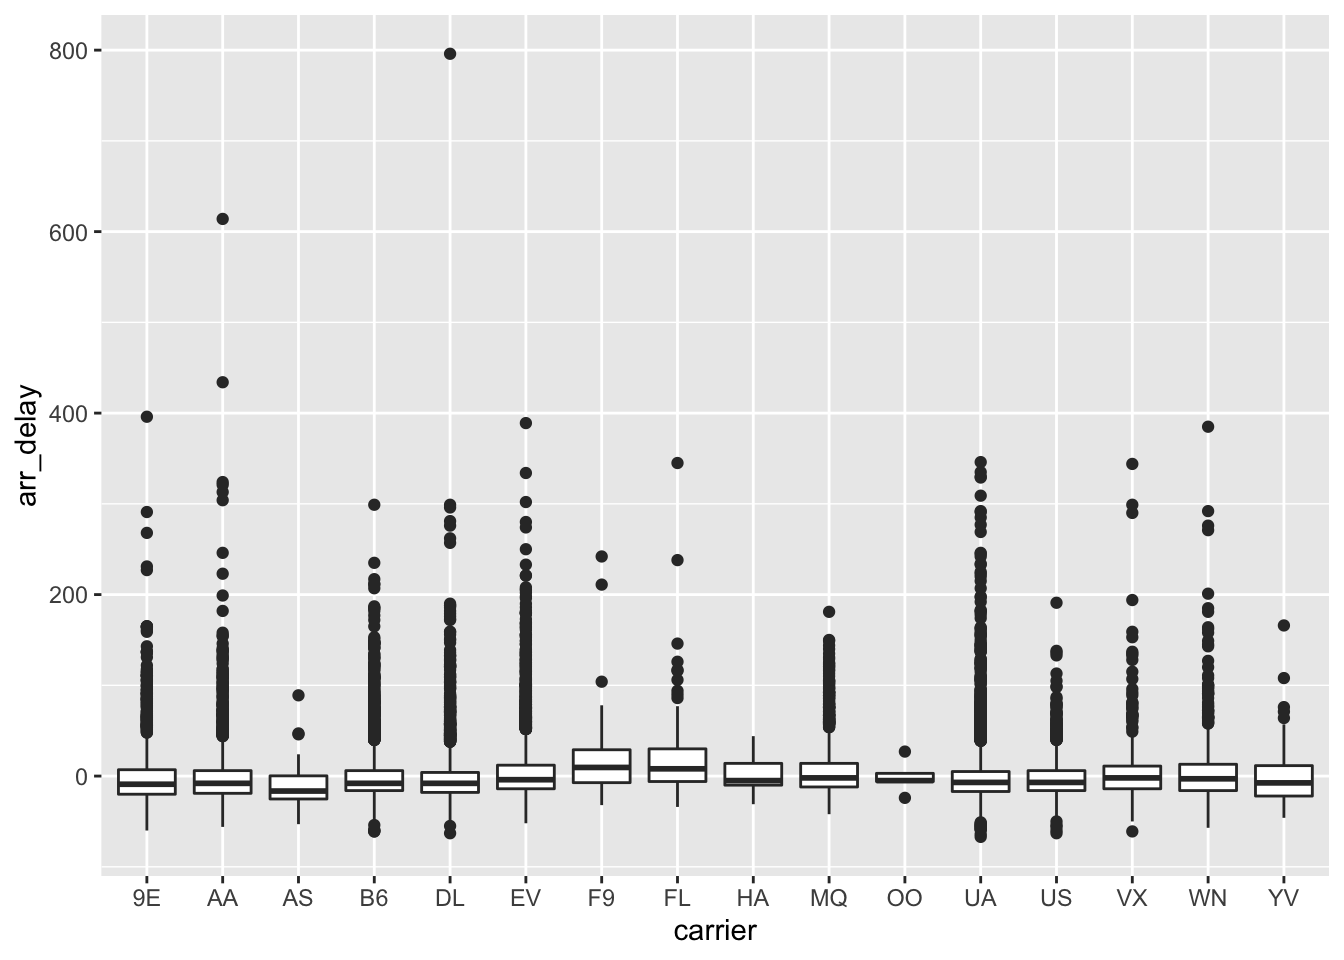
31.6 Boxplots
xcategorical variableyvariable to plotgeom_boxplot
31.7 Boxplots
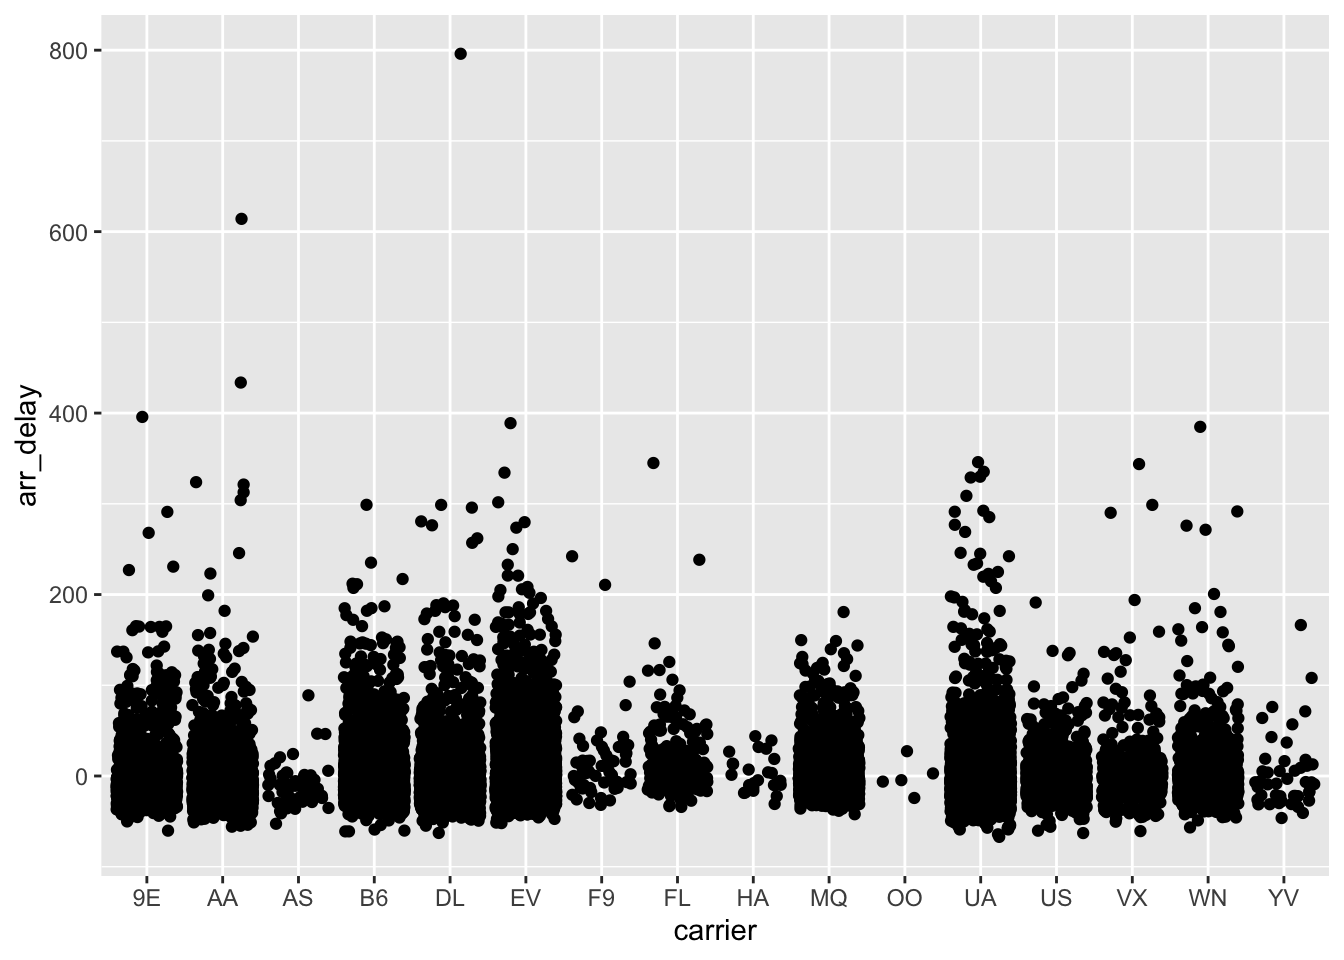
31.8 Jittered points
xcategorical variableyvariable to plotgeom_jitter
31.9 Jittered points
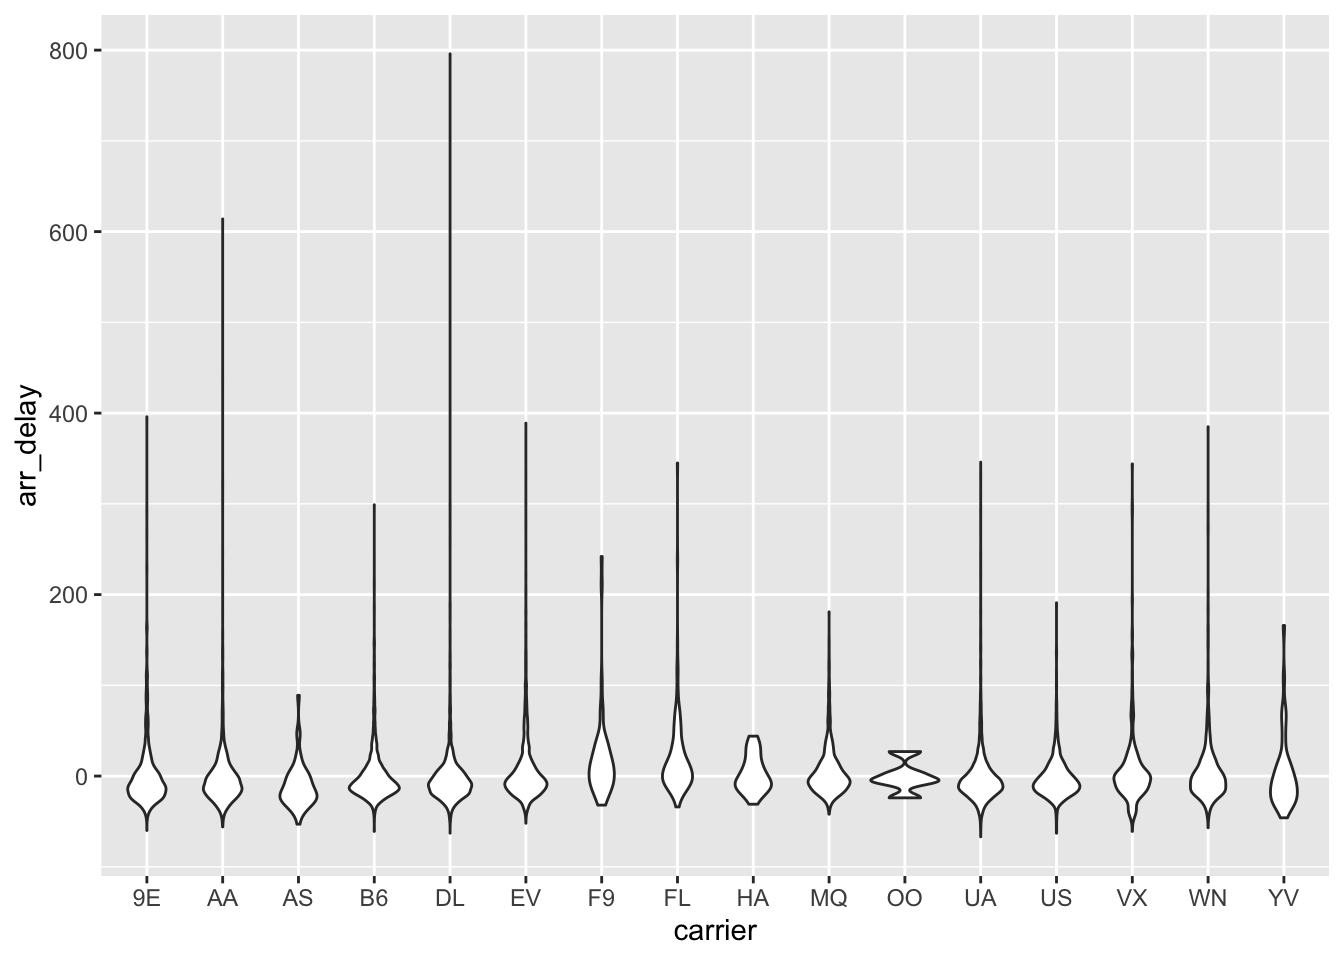
31.10 Violin plot
xcategorical variableyvariable to plotgeom_violin
31.11 Violin plot
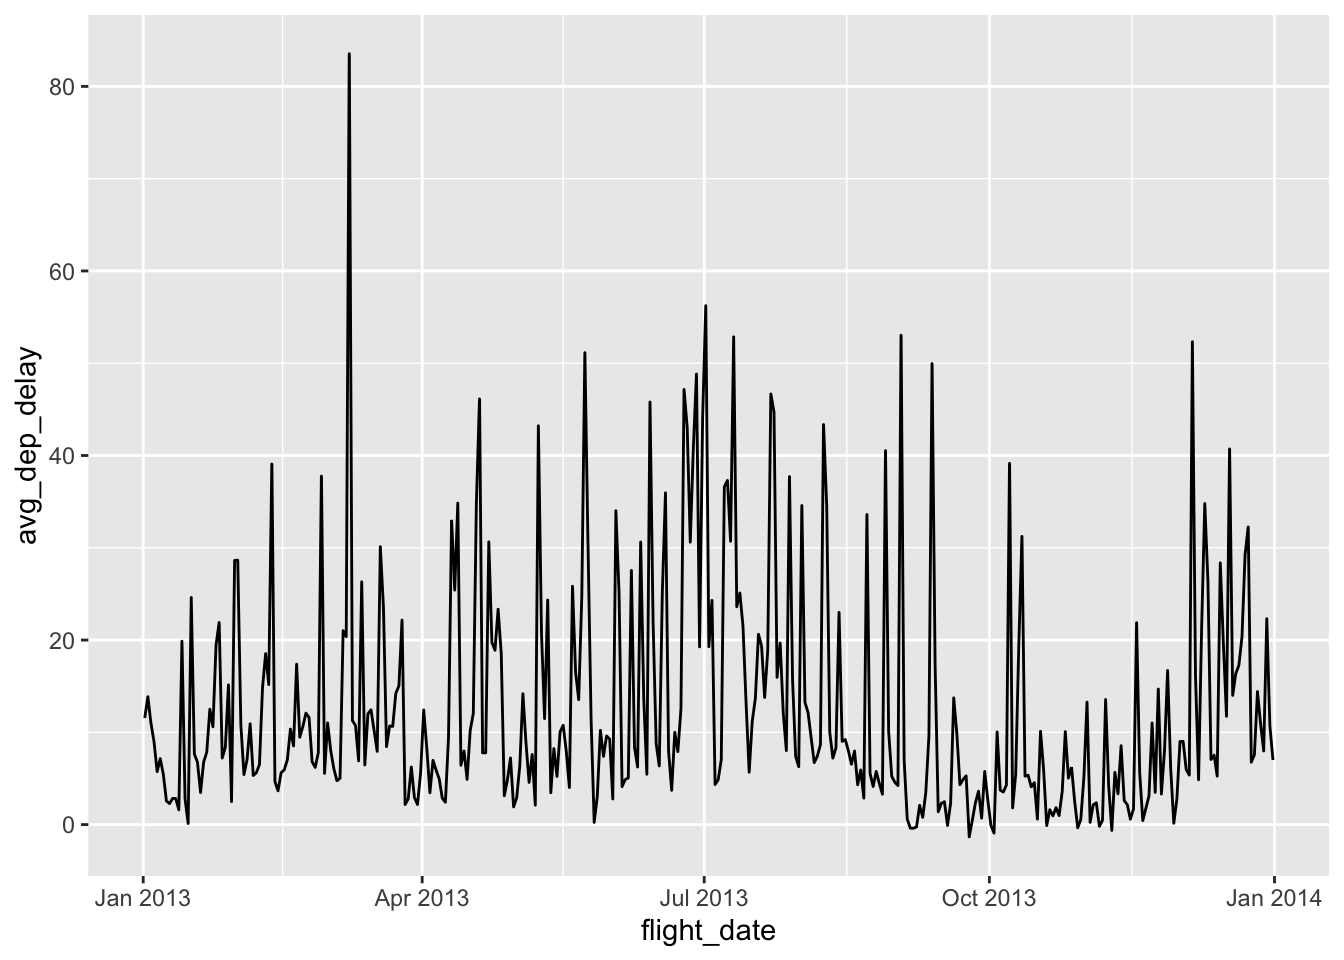
31.12 Lines
xe.g., a temporal variableyvariable to plotgeom_line
31.13 Lines
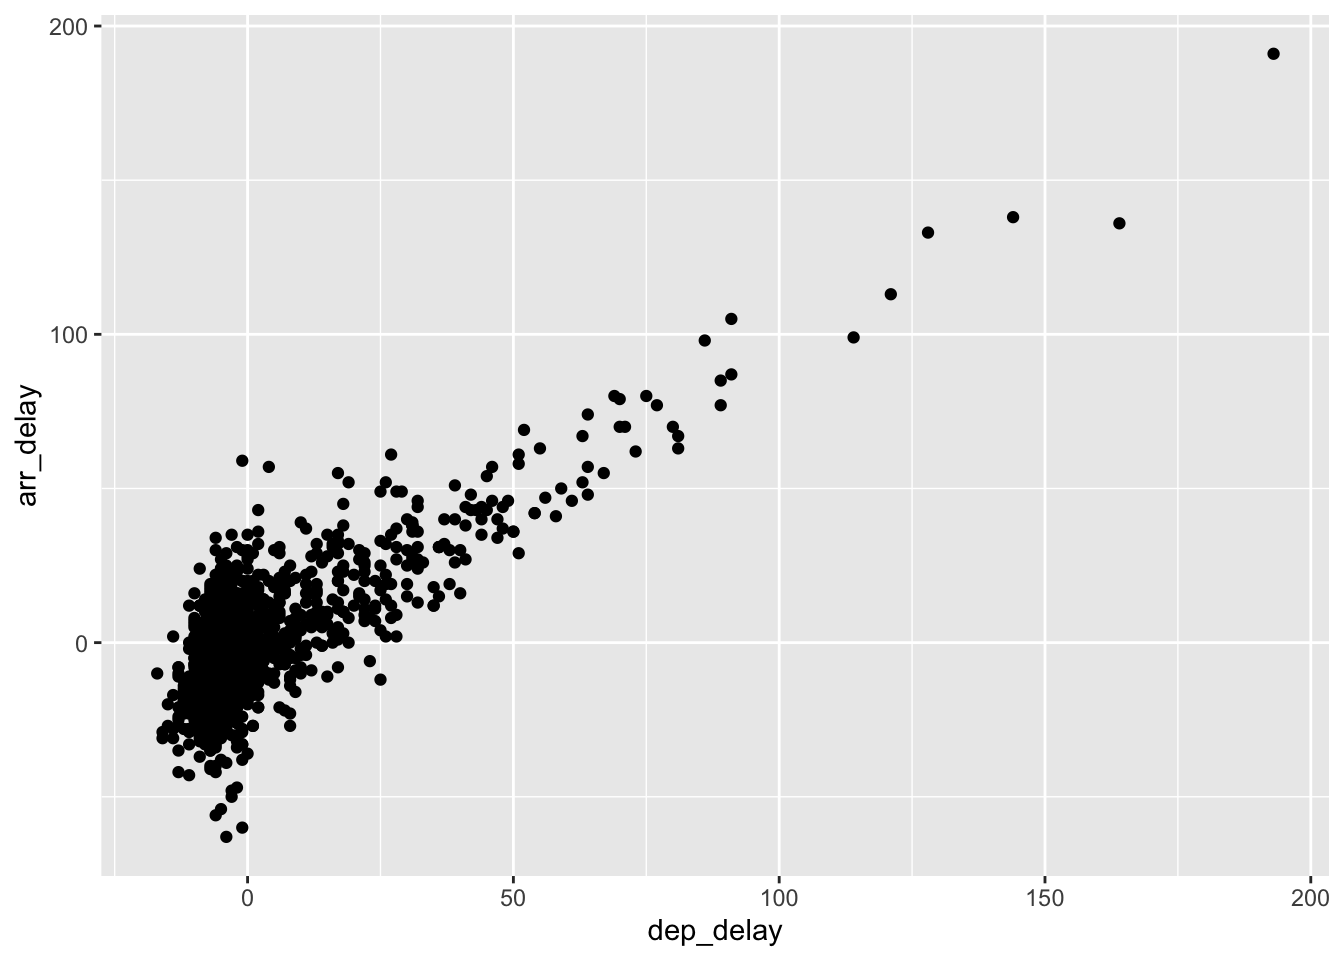
31.14 Scatterplots
xandyvariable to plotgeom_point
31.15 Scatterplots
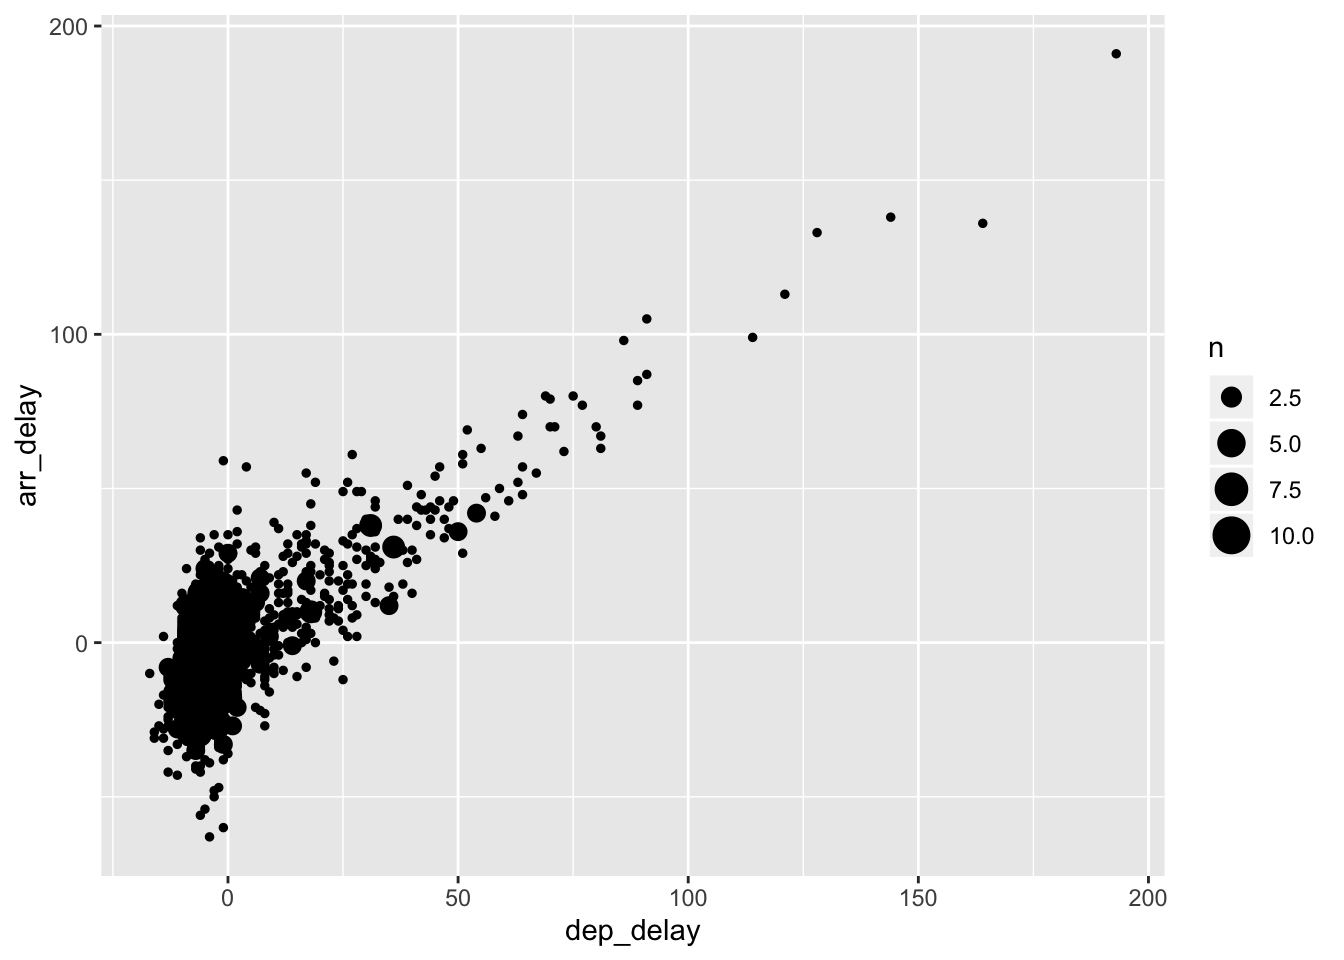
31.16 Overlapping points
xandyvariable to plotgeom_countcounts overlapping points and maps the count to size
31.17 Overlapping points
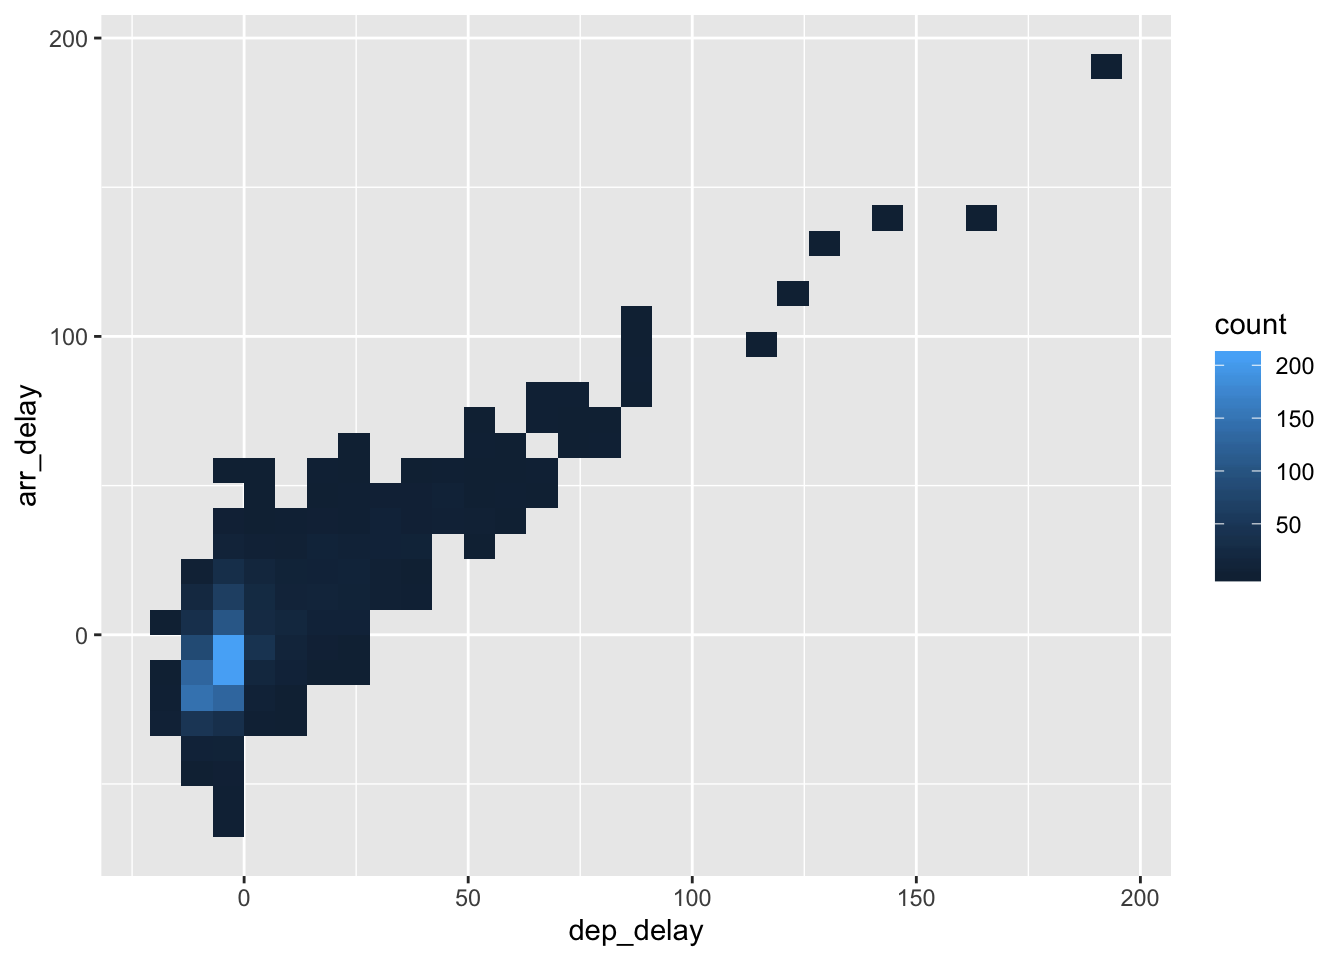
31.18 Bin counts
xandyvariable to plotgeom_bin2d
31.19 Bin counts