37 Lecture 502
Correlation
37.1 Correlation
Two variables can be related in three different ways
- related
- positively: entities with high values in one tend to have high values in the other
- negatively: entities with high values in one tend to have low values in the other
- not related at all
Correlation is a standardised measure of covariance
37.2 Example
flights_nov_20 <- nycflights13::flights %>%
filter(!is.na(dep_delay), !is.na(arr_delay), month == 11, day ==20) 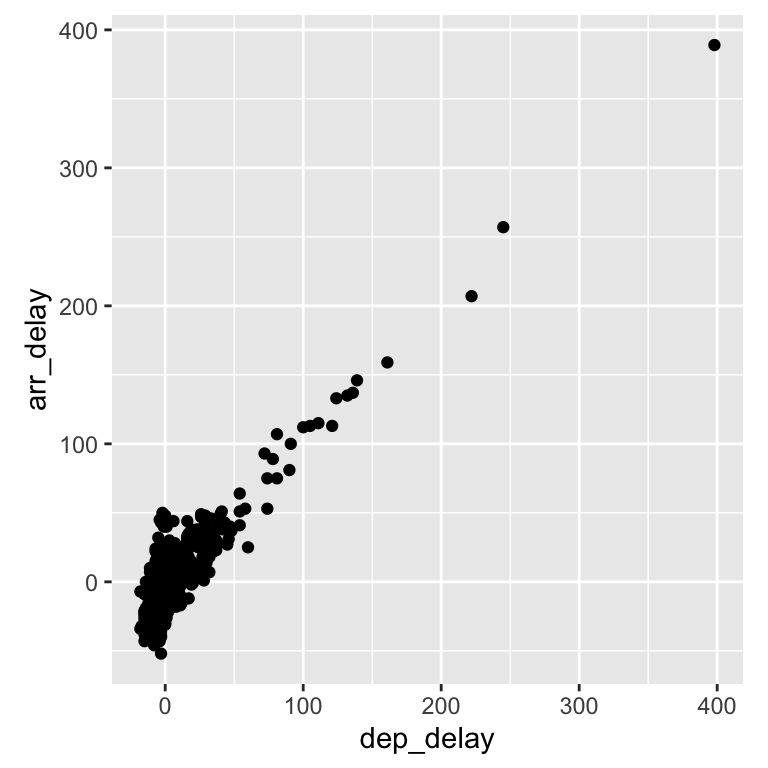
37.3 Example
##
##  Shapiro-Wilk normality test
##
## data:  .
## W = 0.39881, p-value < 2.2e-16##
## Shapiro-Wilk normality test
##
## data: .
## W = 0.67201, p-value < 2.2e-1637.4 Pearson’s r
If two variables are normally distributed, use Pearson’s r
The square of the correlation value indicates the percentage of shared variance
If they were normally distributed, but they are not
- 0.882 ^ 2 = 0.778
- departure and arrival delay would share 77.8% of variance
##
##  Pearson's product-moment correlation
##
## data:  dep_delay and arr_delay
## t = 58.282, df = 972, p-value < 2.2e-16
## alternative hypothesis: true correlation is not equal to 0
## 95 percent confidence interval:
##  0.8669702 0.8950078
## sample estimates:
##       cor
## 0.8817655
37.5 Spearman’s rho
If two variables are not normally distributed, use Spearman’s rho
- non-parametric
- based on rank difference
The square of the correlation value indicates the percentage of shared variance
If few ties, but there are
- 0.536 ^ 2 = 0.287
- departure and arrival delay would share 28.7% of variance
## Warning in cor.test.default(dep_delay, arr_delay, method = "spearman"):
## Cannot compute exact p-value with ties
##
## Spearman's rank correlation rho
##
## data: dep_delay and arr_delay
## S = 71437522, p-value < 2.2e-16
## alternative hypothesis: true rho is not equal to 0
## sample estimates:
## rho
## 0.536124737.6 Kendall’s tau
If not normally distributed and there is a large number of ties, use Kendall’s tau
- non-parametric
- based on rank difference
The square of the correlation value indicates the percentage of shared variance
Departure and arrival delay seem actually to share
- 0.396 ^ 2 = 0.157
- 15.7% of variance
##
## Kendall's rank correlation tau
##
## data: dep_delay and arr_delay
## z = 17.859, p-value < 2.2e-16
## alternative hypothesis: true tau is not equal to 0
## sample estimates:
## tau
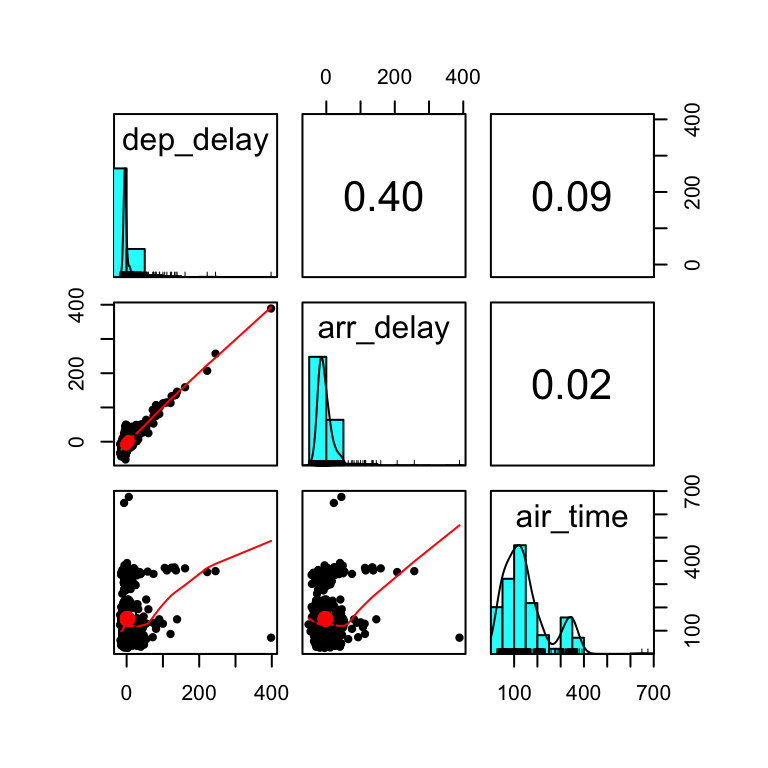
## 0.395626537.7 Pairs plot
Combines in one visualisation: histograms, scatter plots, and correlation values for a set of variables