36 Lecture 502
Comparing means
36.1 Libraries
Today’s libraries
- mostly working with the usual
nycflights13 - exposition pipe
%$%from the librarymagrittr
But let’s start from a simple example from datasets
- 50 flowers from each of 3 species of iris
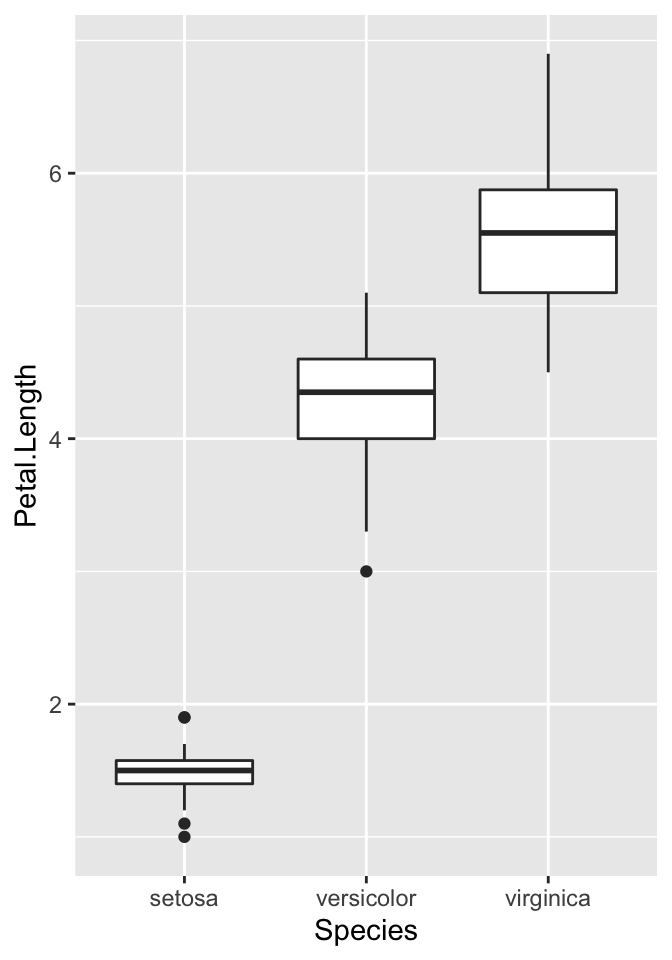
36.2 Example
##
##  Shapiro-Wilk normality test
##
## data:  .
## W = 0.95498, p-value = 0.05481##
## Shapiro-Wilk normality test
##
## data: .
## W = 0.966, p-value = 0.1585##
## Shapiro-Wilk normality test
##
## data: .
## W = 0.96219, p-value = 0.109836.3 T-test
Independent T-test tests whether two group means are different
\[outcome_i = (group\ mean) + error_i \]
- groups defined by a predictor, categorical variable
- outcome is a continuous variable
- assuming
- normally distributed values in groups
- homogeneity of variance of values in groups
- if groups have different sizes
- independence of groups
36.4 Example
Values are normally distributed, groups have same size, and they are independent (different flowers, check using leveneTest)
iris %>%
  filter(Species %in% c("versicolor", "virginica")) %$% # Note %$%
  t.test(Petal.Length ~ Species)
##
## Welch Two Sample t-test
##
## data: Petal.Length by Species
## t = -12.604, df = 95.57, p-value < 2.2e-16
## alternative hypothesis: true difference in means is not equal to 0
## 95 percent confidence interval:
## -1.49549 -1.08851
## sample estimates:
## mean in group versicolor mean in group virginica
## 4.260 5.552The difference is significant t(95.57) = -12.6, p < .01
36.5 ANOVA
ANOVA (analysis of variance) tests whether more than two group means are different
\[outcome_i = (group\ mean) + error_i \]
- groups defined by a predictor, categorical variable
- outcome is a continuous variable
- assuming
- normally distributed values in groups
- especially if groups have different sizes
- homogeneity of variance of values in groups
- if groups have different sizes
- independence of groups
- normally distributed values in groups
36.6 Example
Values are normally distributed, groups have same size, they are independent (different flowers, check using leveneTest)
##              Df Sum Sq Mean Sq F value Pr(>F)
## Species       2  437.1  218.55    1180 <2e-16 ***
## Residuals   147   27.2    0.19
## ---
## Signif. codes:  0 '***' 0.001 '**' 0.01 '*' 0.05 '.' 0.1 ' ' 1
The difference is significant t(2, 147) = 1180.16, p < .01